New in Confluent Cloud: Making Data & Pipelines Accessible for AI-Ready Streaming | Learn More
Diagnose and Debug Apache Kafka Issues: Understanding Reduced Message Throughput
When you encounter a problem with Apache Kafka®—for example, an exploding number of connections to your brokers or perhaps some wonky record batching—it’s easy to consider these issues as something to be solved in and of themselves. But, as you’ll soon see, more often than not, these issues are merely symptoms of a wider problem. Rather than treat individual symptoms, wouldn’t it be better to get to the root of the problem with a proper diagnosis?
If you're looking to level-up your Kafka debugging game and understand common problems as well as the ailments that an individual symptom could be pointing to, then this blog series is for you.
Symptoms in the series
Throughout this blog series, we’ll cover a number of common symptoms you may encounter while using Kafka, including:
- Reduced Message Throughput (this post)
- Increased Request Rate, Request Response Time, and/or Broker Load
- Increased Consumer Rebalance Time
- Increased Connections
These issues are common enough that, depending on how badly they’re affecting your normal operations, they might not even draw much attention to themselves. Let’s dive into each of these symptoms individually, learn more about what they are and how they make an impact, and then explore questions to ask yourself to determine the root cause.
In this post, we’ll cover…
Reduced message throughput
One of the greatest advantages of Kafka is its ability to maintain high throughput of data. Unsurprisingly, high throughput starts with the producers. Prior to sending messages off to the brokers, individual records destined for the same topic-partition are batched together as a single compressed collection of bytes. These batches are then further aggregated before being sent to the destination broker.
Batching is a great thing, and we (generally) want it. But how do you know when it’s working well and when it’s not?
Producer metrics to know
“You can’t manage what you can’t measure.” It’s oft-repeated and perhaps a bit over-used, but it’s true. Thankfully, you can measure quite a bit within your Kafka Cluster through JMX metrics. In this case, the biggest hurdle for most is knowing which of the available producer metrics to actually pay attention to. Here are a few to start off with:
-
kafka.producer:type=producer-metrics,client-id=([-.w]+),name=batch-size-avg: This value describes the average size of batches in bytes sent per topic-partition, per request. Ideally, batch-size-avg will be close—but not too close—to the maximum batch size configured per-producer by batch.size, implying that the producer is filling batches fully before hitting the threshold defined by linger.ms. If this value is consistently lower than batch.size, then your producers might be lingering unnecessarily to fill batches.
-
kafka.producer:type=producer-metrics,client-id=([-.w]+),name=records-per-request-avg: This describes the average number of records per request. If you’re trying to take advantage of batching, you should be monitoring this to make sure more than one record is being added to individual batches and take action if not. For example, if your records are too large, you might see this value be consistently 1; it might be time to look into compression options or increase batch.size.
-
kafka.producer:type=producer-metrics,client-id=([-.w]+),name=record-size-avg: This metric is the average size in bytes of the individual records from a given producer. This value helps you to better understand the record sizes for tuning. For example, if record-size-avg is consistently close to or higher than batch-size-avg, your producers aren’t even attempting to batch messages.
-
kafka.producer:type=producer-metrics,client-id=([-.w]+),name=record-queue-time-avg: This is the average amount of time your record batches spend in the send buffer. Coupled with batch-size-avg this will help you figure out if your batches are being bound by linger.ms or batch.size. (If you’re looking for more tangible experience on how to tune these parameters, check out the producer hands-on from the Kafka Internals course.)
-
kafka.producer:type=producer-metrics,client-id=([-.w]+),name=request-latency-avg: This describes the amount of time between when a producer finally makes a request to the broker to produce records and when the producer receives a response from the broker. Unfortunately, there isn’t a per-broker breakdown of this metric, so you will have to do a little math using this metric and the destination topic-partitions. However this metric, coupled with the setting max.request.size, can help you understand how efficiently your batching is performing with regard to latency. This is important when balancing your batch performance, record latency, and the overall costs when tuning batches.
-
kafka.producer:type=producer-metrics,client-id=([-.w]+),name=requests-in-flight: The final producer metric to keep in mind is the current number of Produce Requests that have been sent to the brokers that are awaiting responses. Ideally, this value should be low, indicating that only a small number of requests are waiting to be fulfilled by a broker.
Now that you understand your producer metrics, you can begin to monitor them properly. But what should you do if you start seeing inefficient batches either in the form of small numbers of records per batch or super large batch sizes? Well, it could be a number of things. The first, perhaps most obvious, step you should take is to check and understand your producer configurations.
Configuring batching
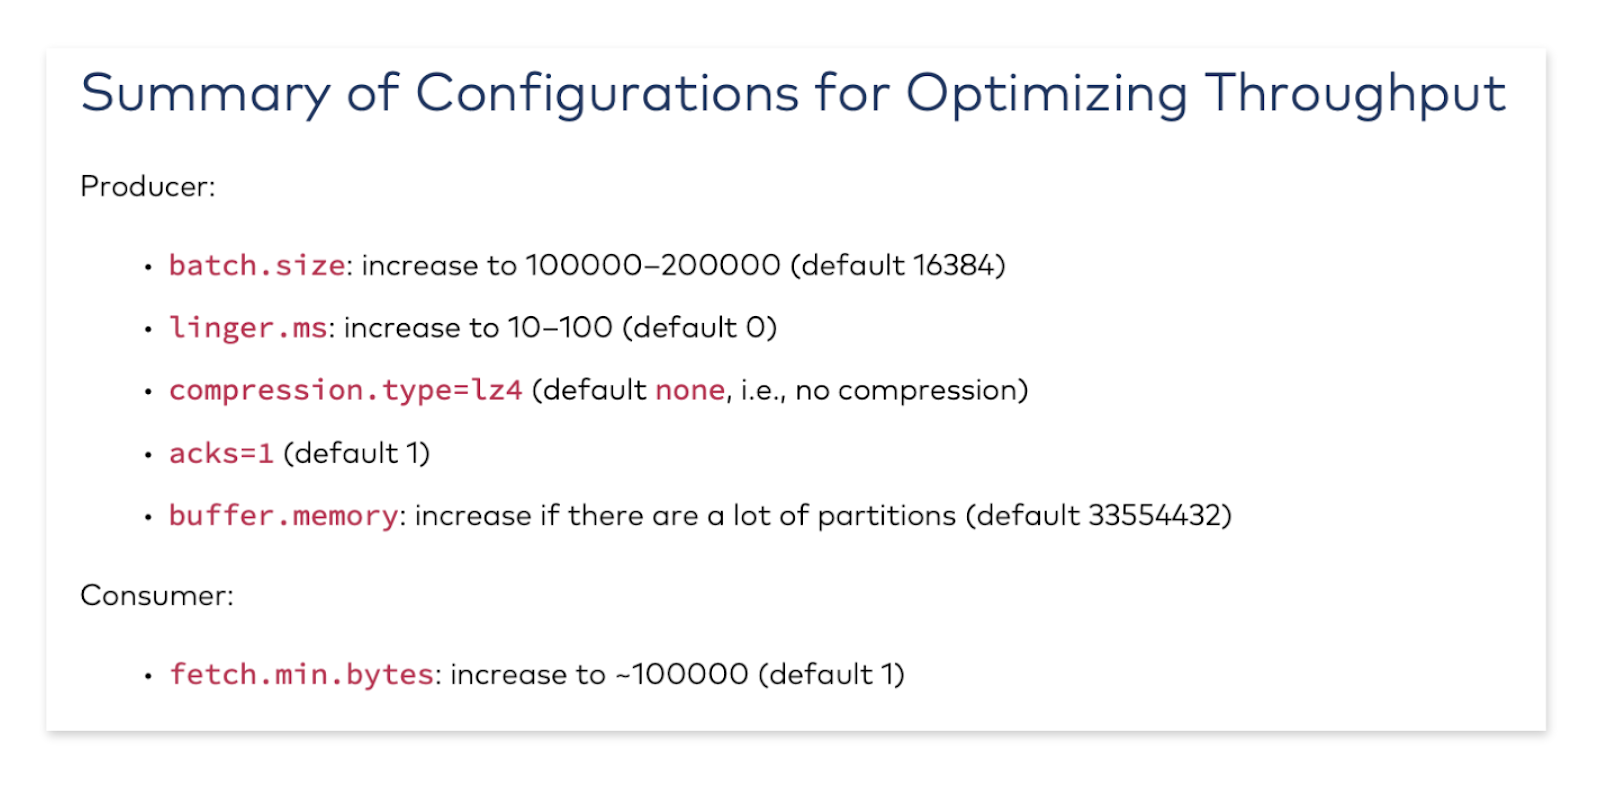
As you may have gathered from the previous section, batching is controlled by a couple of producer configuration settings, including batch.size, linger.ms, and buffer.memory, among others.
-
batch.size is the maximum batch size in bytes that the producer will attempt to group records into; the default is 16384 bytes (16k). To an extent, a larger batch.size can imply more optimal batching, as the producer will be able to group more records together before sending them. Too small of a value for batch.size could mean that batching just isn’t happening at all. Something to keep in mind is that if your individual records are larger than batch.size, the producer won’t even attempt to batch the records; thankfully, if you’re monitoring the right metrics, records-per-request-avg will indicate that something is amiss.
-
While the producer is waiting for batch.size to be reached, linger.ms comes into play. linger.ms is the maximum number of milliseconds that the producer will linger, waiting for more records to be added to a batch before attempting to send it. When producers have many records to send very frequently, increasing linger.ms means that producers can be more efficient, waiting to add records to a batch before sending them; however, if very few records are being produced, linger.ms could add unnecessary latency to single-record batches. The default value is 0, meaning that producers will send records immediately after receiving them.
-
buffer.memory is an often-overlooked but important setting that you may run into while adjusting batch.size. This is the amount of memory the producer will reserve when it is created. This memory is allocated into chunks equal to batch.size. As you can guess, this means the max number of batches that can be created at any given time is controlled by this setting. Also important to note is that a batch won’t deallocate its segment from the buffer until the records contained within are completed, either successfully or not. The metric kafka.producer:type=producer-metrics,client-id=([-.\w]+),name=buffer-available-bytes can assist in monitoring how often you might be approaching this limit.
Efficiently batching records involves good understanding of batch.size, linger.ms and buffer.memory. That being said, there are a number of additional parameters that can be tuned to fully optimize your batching.
Continuing the diagnosis
If your batch-focused configuration settings don’t seem suspect, then the next logical step to properly debug your reduced message throughput is to ask yourself a few additional questions.
In addition to noticing reduced batching…
… have you checked into your topic-partitions lately? It may be the case that some of your topics have too many partitions. It’s pretty common to spread out the load of records across disk space or increase the number of partitions in order to increase parallelization on the consumer side, but having more partitions can have negative repercussions on the producer side of things. Keep in mind that records are batched per topic-partition, so topics with too many partitions are more likely to have sparse batches and linger while waiting for records.
… do you see a high rate of requests being made? If your Kafka cluster is cloud-based, check into your KafkaProducer workloads to see if they’re sized appropriately. When working with cloud-based instances, it’s common to start small. But as requirements change and grow over time, resizing workloads isn’t always the first thing that’s considered––it might be time to scale. As seen above, horizontal scaling can negatively impact batching, though, so, instead, vertical scaling can help constrict the spread of records among service instances to improve batching performance.
… are you seeing increased connections? This could indicate that you’re using multiple KafkaProducer instances within a single service or process. Maybe you’ve recently migrated from another messaging technology and were trying to minimize code changes or perhaps you didn’t quite understand the thread safety of a KafkaProducer. Either way, it could be time to check into your client code.
Conclusion
In the quest for optimized throughput, batching is key. As you’ve seen here, if you’re encountering reduced message throughput, it’s very likely that it’s tied to configuration parameters related to batching… but it could also be a symptom of a deeper issue.
The next time you hit a snag in your Kafka cluster, take some time to diagnose and debug. Before making any changes to your applications or their configurations, it’s important to understand what’s causing your problem and uncover the underlying ailment. Either way, you now have the tools to use and questions to ask yourself in order to properly diagnose and debug your throughput-related ailments.
To continue on in your Kafka practice, check out these other great resources to help you along the way:
- Check out the next symptom in our Diagnose and Debug Apache Kafka Issues series: Understanding Increased Request Rate, Response Time, and/or Broker Load
- Learn more about the inner workings of Kafka using the Kafka Internals course on Confluent Developer.
- Avoid potential problems entirely by diving into common Apache Kafka mistakes and pitfalls that everyone is likely to encounter.
- Give Confluent Cloud a try and see what fully-managed, cloud-based Kafka has to offer you.
- Plug into a community so that you’re not debugging on your own—check out the Confluent Community Slack and Confluent Forum.
Did you like this blog post? Share it now
Subscribe to the Confluent blog


Error Handling Patterns for Apache Kafka Applications
Apache Kafka® applications run in a distributed manner across multiple containers or machines. And in the world of distributed systems, what can go wrong often goes wrong. This blog post […]

Diagnose and Debug Apache Kafka Issues: Understanding Increased Consumer Rebalance Time
Rebalancing comes into play in Apache Kafka® when consumers join or leave a consumer group. In either case, there is a different number of consumers over which to distribute the partitions from the topic(s), and, so, they must be redistributed and rebalanced....