[Webinar] Master Apache Kafka Fundamentals with Confluent | Register Now
Build and monitor Kafka pipelines with Confluent Control Center
On May 24, we announced Confluent Control Center, an application for managing and monitoring a Kafka-based streaming platform. Control Center has a beautiful user interface, and under the surface we did a lot of work to make Control Center work beautifully. In the first release of Control Center, we focused on two problems: getting started quickly with Kafka, and understanding message flow end to end. These two features complement each other: you can easily build an enterprise-scale data pipeline and monitor message flow through that pipeline to guarantee that every message is delivered. This blog post will tell you why we built Control Center, highlight some unique features, and tell you how it works.
Create a complete data pipeline in minutes
Kafka Connect (introduced in Apache Kafka 0.9) makes it easy to create, manage, and run connectors to other systems. Kafka Connect solves a set of problems every new data import or export tool has to solve: scaling to production size data, coping with slow connections and failures, and managing evolution of data formats. Kafka Connect handles all the hard parts internally, so developers just have to describe how to connect to external systems. At Confluent, we’ve been thrilled with the community adoption of Connect, and amazed at the quality and variety of connectors already available. (You can learn more about available connectors at the Connector Hub: /product/connectors.) To help users get started quickly with Kafka, we built a web-based GUI for Kafka Connect in Control Center.
Our Kafka Connect configurator makes it easy to manage and monitor connectors. We wanted to show all required and optional configuration options, and make them easy to set correctly. We didn’t want to build a custom UI for every connector, and wanted community written connectors to work as well as Confluent written connectors. To make this possible, we designed our configurator to automatically render a form for each connector. Control Center uses the Kafka Connect API to discover the names, descriptions, and types of configuration options. It gets information on how parameters are related to each other and ordered. It then automatically creates an easy to read, logically structured form for each connector.
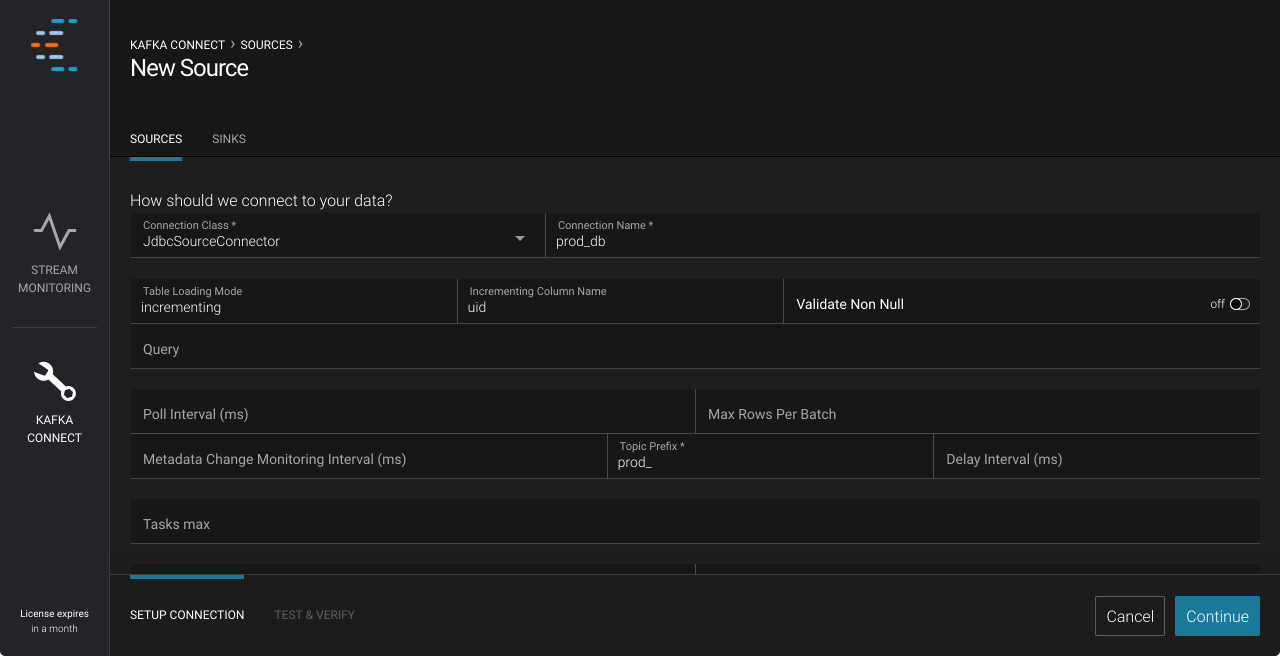 Example: Configuring a database connection in Control Center
With the Kafka Connect Configuration GUI, you can build a complete data pipeline in minutes. Whether you are trying to build an enterprise scale ETL pipeline, or just want to pump data through a test cluster for QA, you’ll find it easy to get started with Control Center.
Verify Delivery with Data Stream Monitoring
If you oversee a data pipeline, you need to know if every message produced is eventually consumed. If you are responsible for cluster operations, you need to make sure that you are meeting your SLAs. If you are a real-time application owner, you need to understand if your application is producing (or consuming) all the data you expect it to.
If you can’t guarantee that your pipeline is complete, you can’t trust your data. Suppose that all your business data is passing through a data pipeline. A reporting application shows a drop in revenue. If the pipeline isn’t complete, maybe the “drop in revenue” is just a result of missing data. To trust your applications, you need proof that your data is complete and correct.
Apache Kafka provides metrics about how individual clients and brokers are working, but doesn’t let you see the big picture. You can measure latency at many stages, look at bandwidth through each component, and even look at the size of data structures within brokers. These metrics are valuable for tuning your cluster or finding problems with individual components, but it’s hard to use these metrics to prove that your applications are getting a complete and correct stream of data.
Today, it’s hard to verify that every message is delivered. You can audit delivery by hand, checking message counts (and other summary statistics). Alternately, you can write custom tools to collect and validate metrics across your company. Both options are labor intensive and error prone.
We built Stream Monitoring to make verification easy. If everything is running smoothly, Stream Monitoring provides proof of delivery. If a message is lost (or duplicated) in an application, over the network, or in a broker, Stream Monitoring will help you discover it. Stream Monitoring provides end to end metrics to show you the big picture.
To explain how it works, let’s consider an example. Suppose you have a set of three producers feeding data into Kafka, and have a set of three applications (and thus three consumer groups) consuming data from Kafka. Now, suppose that between 4:36 PM and 4:37 PM, one web server log produces 59 messages, another web server log produces 60 messages, and the database log produces 60 messages (a total of 179 messages). We would expect each application (specifically, each consumer group) to receive all 179 messages a short time later.
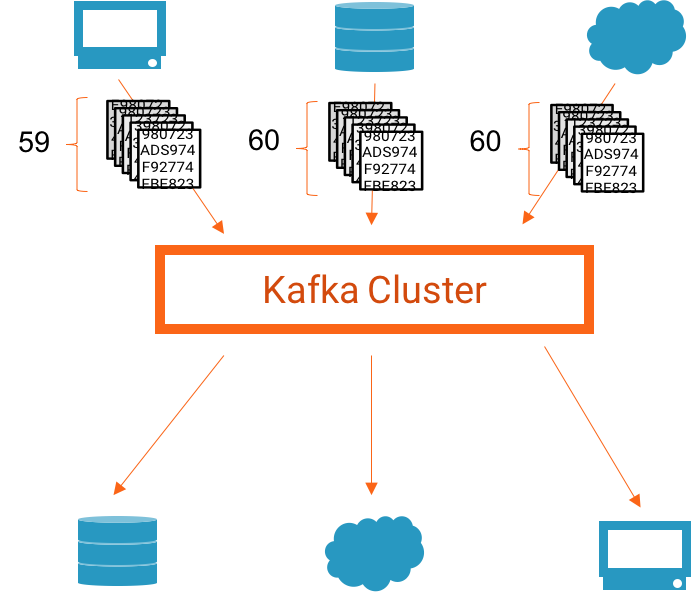
An example system. Step one: 179 messages are produced
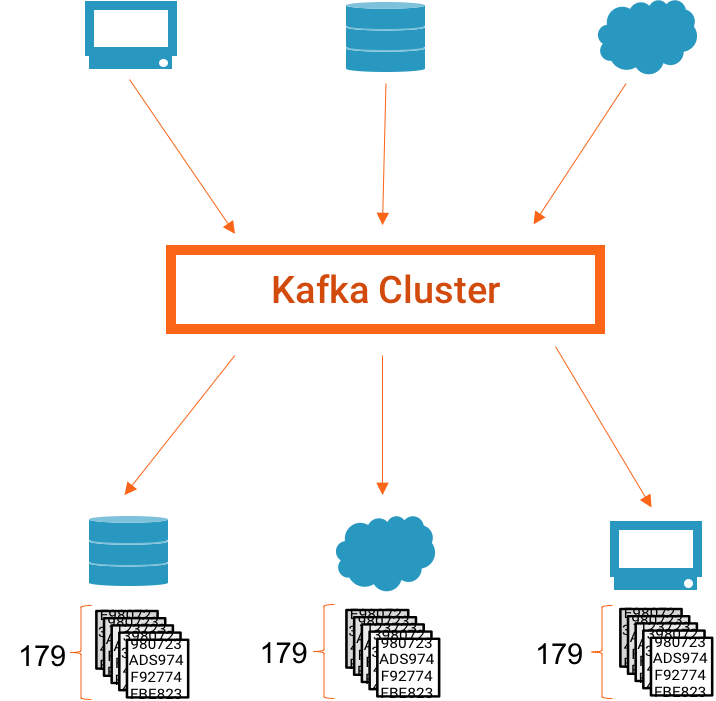
An example system. Step 2, when everything works: 179 messages are consumed
As an administrator or application owner, you’d want to know that the number of messages consumed matches the number produced. And if one application didn’t consume the expected number of messages, you’d want to know which application didn’t consume the expected number (so that you could investigate and fix the problem).
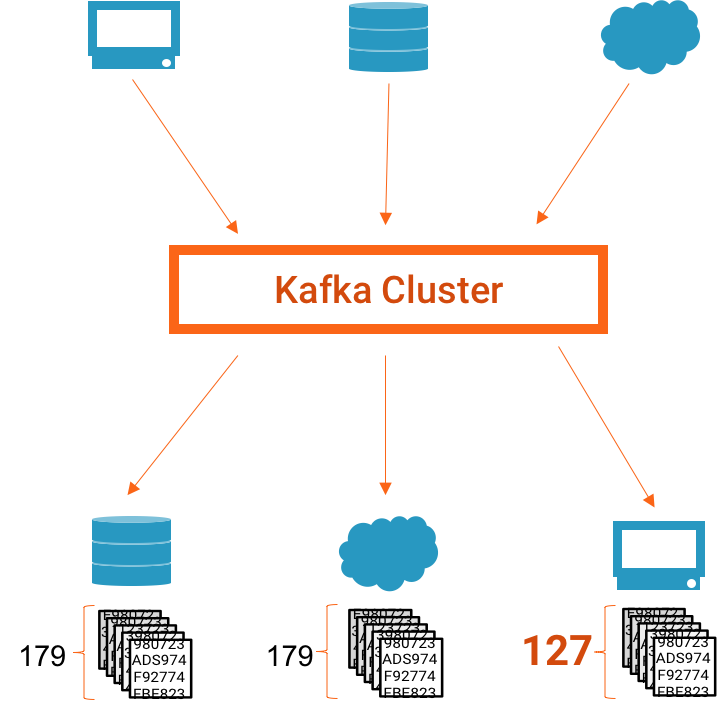
An example system. Step 2, but something goes wrong and 127 messages are consumed.
Stream Monitoring provides detailed information on messages produced and consumed over time: the number of messages produced, how many of those messages are eventually consumed, and how long it takes for them to be consumed. We allow you to drill down by consumer group, topic, and partition to narrow down problems.
In the example above, we assumed that not every message produced was consumed. If this system were monitored with Stream Monitoring, you might see something like this in Control Center:
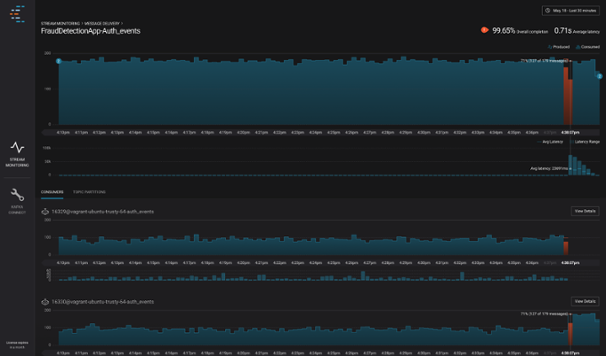
Stream Monitoring, showing what happens if a consumer stops, showing 127/179 messages delivered during this time period.
At the top of the screen, we show a summary of overall delivery for this application (or consumer group). If the number consumed does not match the expected number, we highlight the issue in orange to make it easy to see. Lower on the screen, we show data for specific consumers. You can clearly see that the top most consumer stopped processing messages at about 4:36 PM.
Stream Monitoring makes it easy to verify and analyze message delivery. Several features of Stream Monitoring make it easy to deploy, easy to use, and easy to trust:
Works with Kafka Clients, Kafka Connect, and Kafka Streams
Stream Monitoring is designed to work with anything you connect to Kafka: custom applications that use the Apache Kafka clients, data pipelines controlled by Kafka Connect, or real time applications built with Kafka Streams. In the Confluent Platform, Kafka Connect is already configured for monitoring by Control Center. To monitor a user application, you simply deploy a small plugin (called an interceptor) with your application, and configure the application to use this plugin.
Drill down to individual clients and partitions
Not only do we measure data end to end, but we collect metrics for each client, topic, and partition during each time window and present it in the GUI. We aggregate this data and present it to you clearly, so you can drill down into different parts of your system. This detailed data helps you monitor individual applications, topics, or machines.
Even though we measure every message and collect detailed metrics, Control Center doesn’t need a lot of network bandwidth or storage. We collect a small but thorough set of metrics from each client including counts and checksums, then aggregate them on the Control Center server. This allows Control Center to scale up to very large clusters with thousands of clients, hundreds of topics, and tens of thousands of partitions.
Monitor what’s happening now, or view history
We let you see what’s happening on your cluster currently, and constantly update the application to show you the latest metrics. If a problem occurs, you’ll be able to tell right away. Control Center lets you explore historical metrics as well; you can view data from the past just as easily as current data. And if you find something interesting, you can easily share a link with someone else in your organization.
Built-in Error detection
It was very important to us to prevent any errors in Stream Monitoring (either false reports of lost data or missing reports of lost data), so we used a variety of error detection techniques. Control Center has the ability to detect lost or duplicate messages, including rare cases where there both might occur during the same time window. Control Center also detects cases where the metrics data used for Stream Monitoring is lost (for example, if a client is killed in the middle of a time window), and displays this differently in the user interface. As shown below, we color the time range with a set of orange and black diagonal lines, telling you to use “caution” when viewing data during this time period.
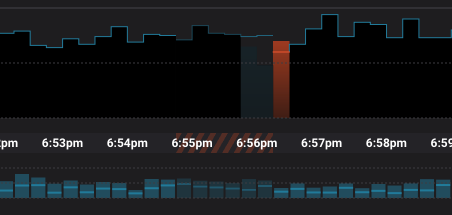
A close-up showing the warning for a period with incomplete data
Stream Monitoring and Kafka Connect: Like Chocolate and Peanut Butter
Stream Monitoring can be used with any application that uses the Apache Kafka clients, including Kafka Connect and Kafka Streams. With Confluent Platform Enterprise, you can quickly create a streaming data pipeline with Connect and monitor delivery of every message end to end with Stream Monitoring. Now, you can start publishing data into Kafka from an external system, write data to an external system, and see how your pipeline is running— all without writing a line of code. You’ll be able to just turn on Control Center and see what’s happening in your data pipeline, and not worry about where the metrics are coming from or how they’re being calculated.
Try the Confluent Platform 3.0 including Control Center
The Confluent Platform is an open source, Apache licensed distribution of Apache Kafka. Confluent Control Center is the first enterprise feature that we are pairing with this open source offering.
Confluent Control Center is an application with a web-based user interface that you can install on your cluster. Control Center requires Apache Kafka 0.10.0.0 or above. Confluent Platform 3.0 (including a 30-day trial of Control Center) is available for download on /download. After the trial period, Control Center will only be available for Confluent Platform Enterprise subscribers. To learn more about Confluent Platform Enterprise, contact us and someone from our team will be in touch. Watch the recorded Confluent Control Center demo to see it in action.
Did you like this blog post? Share it now
Subscribe to the Confluent blog


New With Confluent Platform 8.0: Stream Securely, Monitor Easily, and Scale Endlessly
This blog announces the general availability (GA) of Confluent Platform 8.0 and its latest key features: Client-side field level encryption (GA), ZooKeeper-free Kafka, management for Flink with Control Center, and more.