[Virtual Event] Agentic AI Streamposium: Learn to Build Real-Time AI Agents & Apps | Register
Seamless SIEM – Part 2: Anomaly Detection with Machine Learning and ksqlDB
We talked about how easy it is to send osquery logs to the Confluent Platform in part 1. Now, we’ll consume streams of osquery logs, detect anomalous behavior using machine learning (ML), and provide solutions for handling these anomalous events in ksqlDB and the Confluent Platform.
Behavioral anomaly detection
Learning how users and operating systems normally behave and detecting changes in their behavior are fundamental for anomaly detection. In this use case, osquery logs from one host are used to train a machine learning model so that it can isolate anomalous behavior in another host. We’ll use this model in ksqlDB to score real-time osquery logs and route them to different topics.
Machine learning model – Latent Dirichlet allocation (LDA)
LDA is a text mining technique that groups or clusters text documents into similar themes, characteristics, or LDA topics (topics in LDA are clusters of documents; they are not Apache Kafka® topics). An LDA model will be trained to learn the normal operating system behavior and score real-time osquery logs for anomalous behavior. It can be swapped out for a deep learning model or for one that consumes continuous data like a regression model. LDA specifically consumes discrete text data.
Anomaly detection using machine learning

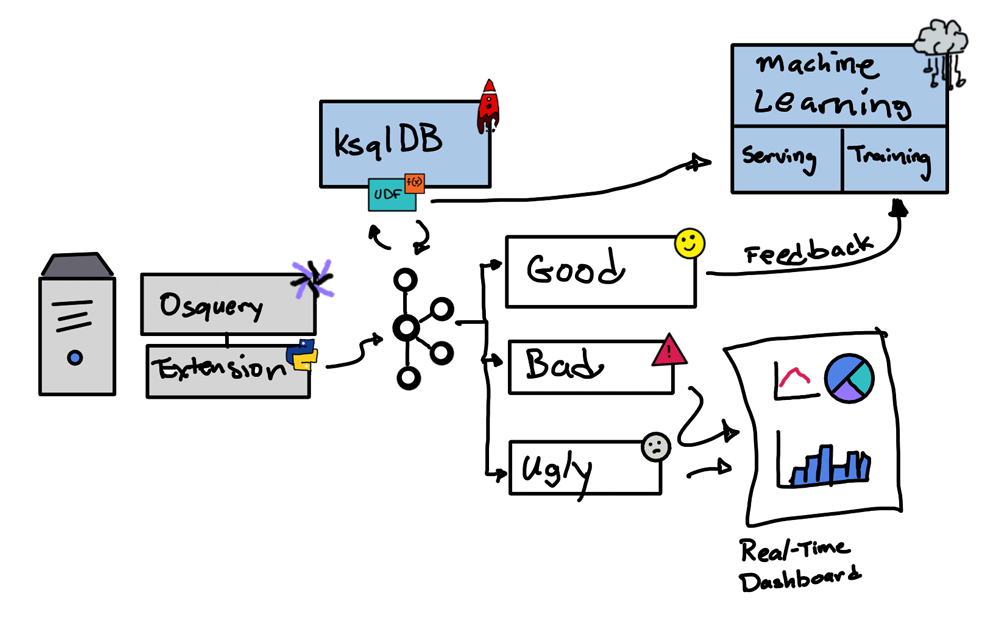
This diagram shows the big picture of how osquery events get routed using ksqlDB and machine learning. The user-defined function (UDF) enriches the events by calling a model service that provides a score. That score is used to route events to different topics: GOOD, BAD, and UGLY. GOOD means a score greater than .7, UGLY means a score between .3 and .7, and BAD means a score less than .3. The bad and ugly events can then be consumed by a real-time dashboard for viewing. The good events are used to feed back the machine learning training to produce updated models.
The good, the bad, and the ugly
The score provided by the machine learning model is used to categorize the osquery events. GOOD means that the event appears to be a normal osquery log. These logs are used to retrain the model so that it can recognize normal osquery logs better.
BAD means that the event meets the threshold of being a suspicious osquery log. These logs can be sent to a real-time dashboard or a security information and event management (SIEM) system like Splunk or IBM QRadar for a threat hunter to further investigate.
UGLY means that we are not confident enough to label the osquery log as GOOD or BAD, requiring human or even more advanced machine learning or artificial intelligence (AI) processing for further analysis. After analysis, these logs should be moved either to the GOOD topic, where they can retrain/retune the model to recognize these events, or to the BAD topic so that it can be investigated by a threat hunter.
Machine learning workflow

Training a machine learning model is usually a batch process that can take hours to complete. We’ll follow this more typical use case where the model is trained as a batch process, although there are ways to train a model with stream processing (sometimes called online machine learning and using stochastic methods).
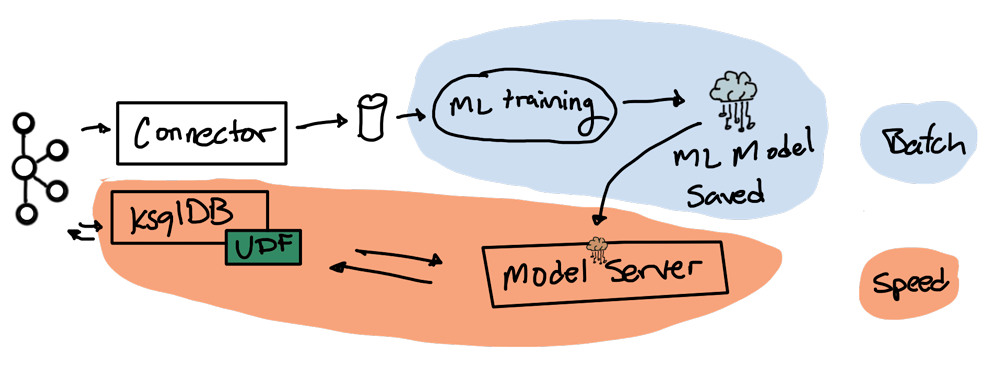
There are two pipelines in this workflow diagram which are setup in a Lambda Architecture: batch and streaming. The batch pipeline trains the LDA model and saves it in a place where the model server can load it. The streaming pipeline scores incoming logs in real time using the most recently generated LDA model it obtained from the batch pipeline.
The ksqlDB UDF scores incoming messages. It enriches the event with a new column called score. The score is obtained by calling the model server, which has loaded the latest LDA model. Subsequent ksqlDB queries are used to route good, bad, and ugly osquery logs to their corresponding topics.
Running the demo
# get the code
git clone https://github.com/hdulay/demo-scene

# change directory the location which builds the Confluent Platform
cd demo-scene/osquery/cp

# build and create the Kafka cluster
make build
make up

# show the running containers
make ps

# wait 30 seconds for everything to start then start a ksqldb shell
docker exec -it ksql-cli ksql http://ksql-server:8088
Creating a stream from osquery events with ksqlDB
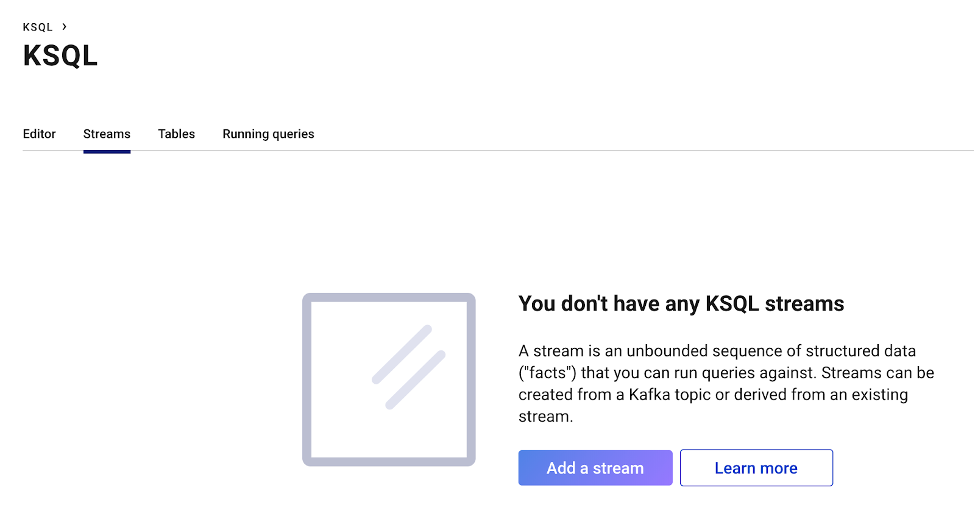
Navigate to the ksqlDB page above, and create a stream from the topic processes by clicking on “Add a stream” if you have not yet done so from part 1. Set “Encoding” to “JSON” and keep the default values for the rest of the fields.
Creating sink connectors with ksqlDB
In the ksqlDB shell, paste the statements below. Their corresponding comments describe their purpose and how they fit into the first and second diagrams depicted above.
/* selects osquery process logs that belong only to host1 for training */
CREATE STREAM training as
    select * from processes
    where hostidentifier = 'host1'
    emit changes;

/* creates a connector to feed the model with training data */
CREATE SINK CONNECTOR training WITH (
    'connector.class' = 'FileStreamSinkConnector',
    'key.converter'  = 'org.apache.kafka.connect.storage.StringConverter',
    'value.converter' = 'org.apache.kafka.connect.storage.StringConverter',
    'topics' = 'TRAINING',
    'file' = '/project/cp/logs/train.log'
);

/* scores the osquery log using a UDF */
CREATE STREAM scored as
    select
        hostidentifier as host,
        columns['path'] as path,
        columns['name'] as name,
        columns['cmdline'] as cmdline,
        columns['cwd'] as cwd,
        columns['root'] as root,
        columns['state'] as state,
        action,
        lda(hostidentifier,
            columns['path'],
            columns['name'],
            columns['cmdline'],
            columns['cwd'],
            columns['root'],
            columns['state'],
            action
        ) as score
    from processes;

/* routes good logs to the good topic */
CREATE STREAM good as
    select *
    from scored
    where score >= .7
    emit changes;

/* routes bad logs to the bad topic */
CREATE STREAM bad as
    select *
    from scored
    where score < .3
    emit changes;

/* routes ugly logs to the ugly topic */
CREATE STREAM ugly as
    select *
    from scored
    where score >= .3 and score < .7
    emit changes;

/* creates a connector to feedback good logs to the model trainer */
CREATE SINK CONNECTOR feedback WITH (
    'connector.class' = 'FileStreamSinkConnector',
    'key.converter'  = 'org.apache.kafka.connect.storage.StringConverter',
    'value.converter' = 'org.apache.kafka.connect.storage.StringConverter',
    'topics' = 'GOOD',
    'file' = '/project/cp/logs/feedback.log'
);
Proceed to the topics page in Confluent Control Center and monitor the topics GOOD, BAD, and UGLY. The LDA model will need about 100,000 training events to perform properly. You will not get good scores until your training data reaches that amount. Once you have an adequate amount of training data, you can trigger an anomalous event in host2, such as head -c 1G </dev/urandom >myfile. Make sure you don’t run this command in host1 since it is being used for training. You should expect this event to have a low probability score and end up in the BAD topic.
Recap
Building upon part 1, we’ve now published osquery logs into the Confluent Platform and trained an LDA model to learn from it. Then we deployed the model and called it from a ksqlDB UDF to enrich it with a score. Subsequent ksqlDB statements consumed the scored events to route them to the topics GOOD, BAD, and UGLY.
There are many ways to expand this use case, including publishing the bad and ugly logs to a SIEM system or external datastores using Kafka Connect for additional investigation and real-time alerting. The ease by which we built a seamless SIEM pipeline using Confluent Platform, Kafka Connect, and ksqlDB helps with building a minimum viable product for any budding security project.
If you’re interested in learning more, download the Confluent Platform to get started with a complete event streaming platform built by the original creators of Apache Kafka.
Did you like this blog post? Share it now
Subscribe to the Confluent blog
Why ELT Can't Keep Up in the Era of High-Scale Data Engineering
Batch ELT pipelines create duplication, cost spikes, and governance gaps as data scales. Here’s why enterprises are rethinking legacy integration models.
How to Protect PII in Apache Kafka® With Schema Registry and Data Contracts
Protect sensitive data with Data Contracts using Confluent Schema Registry.


