New in Confluent Cloud: Making Data & Pipelines Accessible for AI-Ready Streaming | Learn More
What’s New in Health+: 7 New Dashboards, 70% Monitoring Infra Savings
Not all telemetry data is created equal, but Health+ can help you prioritize the most important bits.
If you’re reading this blog post, it’s quite likely that you are in a world where you and your team have a ton of telemetry data at your disposal as you operate and maintain your Apache Kafka® deployment.
However, not all telemetry data is created equal, and you’re probably not sitting in front of a live dashboard at all hours waiting for an incident to occur. So how do you efficiently sift through this vast sea of information, set up the right alerts and monitoring to keep your deployments healthy, and identify potential critical issues before they begin to affect performance—all while keeping your team focused on mission-critical applications? This question is usually a difficult one to answer!
Today we’ll cover exactly how you can do that easily with the latest features in Health+, the gold standard when it comes to intelligent monitoring, alerting, and maintenance for Apache Kafka and Confluent Platform. Health+ offers a cloud-based, scalable solution that can reduce your Kafka monitoring costs by up to 70%. Read on to learn more about the problems that Health+ solves, the newest features that we’re constantly adding to Health+, and how it all works within the broader Apache Kafka and Confluent ecosystem.
What’s new!
Not all monitoring dashboards are created equal, but Health+ starts you off with a comprehensive set of the most important metrics built upon our experience running thousands of clusters in Confluent Cloud. Here’s what’s new.
Folks often run into some common issues when setting up dashboards for visualization:
- Where do you draw the line on relevant metrics?
- Are all the right metrics being shown?
- How do you quickly identify if a particular metric has gone bad or is trending badly?
- How can I keep dashboards updated w/ the newest telemetry data and platforms?
Health+ helps to address these problems. Over the past year, we’ve worked closely with customers who are early adopters and power users of Health+. We’ve listened to their feedback and perspectives as they’ve used Health+ in order to understand which features and metrics are most valuable—and we’ve also been grateful for the feedback we’ve received, which we directly incorporate as we plan and build new Health+ features into our roadmap.
As a result of these collaborative efforts, we’re adding seven new categories of dashboards, which cut through the noise of your telemetry data and get to the heart of key insights into the health of your Apache Kafka and Confluent Platform clusters.
These dashboards instantly spin up once Confluent’s Telemetry Reporter is activated on your Confluent Platform component. (If you’re an existing Health+ user, these dashboards will be available to you automatically without any intervention required!)
Here’s a brief description of each one:
- Kafka Health: Covers some of the core metrics that indicate the health of your cluster related to leaders, partitions, and controller counts
- System: Lower-level metrics that indicate the health of the system that Kafka cluster is running on
- Producers: Focuses on the health of Kafka produce requests that are incoming such as produce latencies, request sizes, and error rates
- Consumers: Focuses on the health of Kafka consumption requests (aka fetches) that are outbound reporting on similar metrics like producers
- Throughput: Provides insights on the overall throughput across the Kafka cluster
- Thread utilization: Important metrics on network processor and request handler usage across the cluster
- Topics: Core metrics on the topics that reside in your cluster
- ksqlDB: Key metrics to observe the health of your attached ksqlDB cluster and queries
- Connect: Key metrics to observe the health of your attached Connect cluster and connectors
These aren’t just scattered dashboards—we’ve put a lot of thought into making sure that both new and power users of Health+ see an organized list of the most helpful, commonly used dashboards as indicated by our customers and our team..
Two dashboards to call out are the addition of Connect and ksqlDB. The metrics included in these dashboards provide insights on the health of your Connect or ksqlDB cluster that is connected to the Kafka cluster you are observing. For Connect, metrics related to the status (Failed, Running, Degraded) are included and for ksqlDB, metrics related to the status of queries and processing errors are represented. The addition of these dashboards complements our previously released Intelligent Alerts for these mertrics.
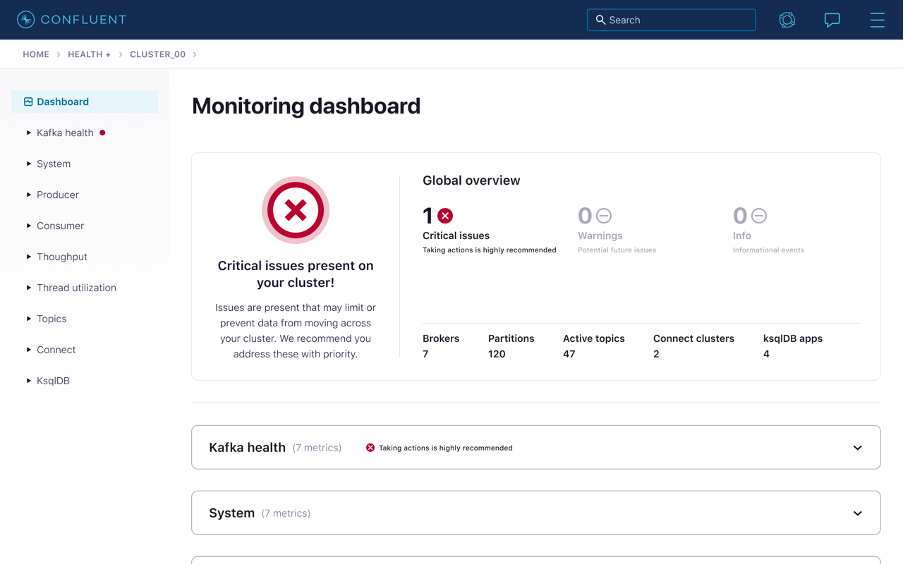
Not only do Health+ dashboards highlight and organize the most important Kafka metrics, they also quickly highlight any metrics that are trending towards an unhealthy state, and each dashboard displays your deployment’s overall health at the top, with any warnings and critical alerts immediately called out. And you can expand and double click on any of these metrics or alerts to find out more about what’s going on and see suggestions for resolution.
A healthy state cluster
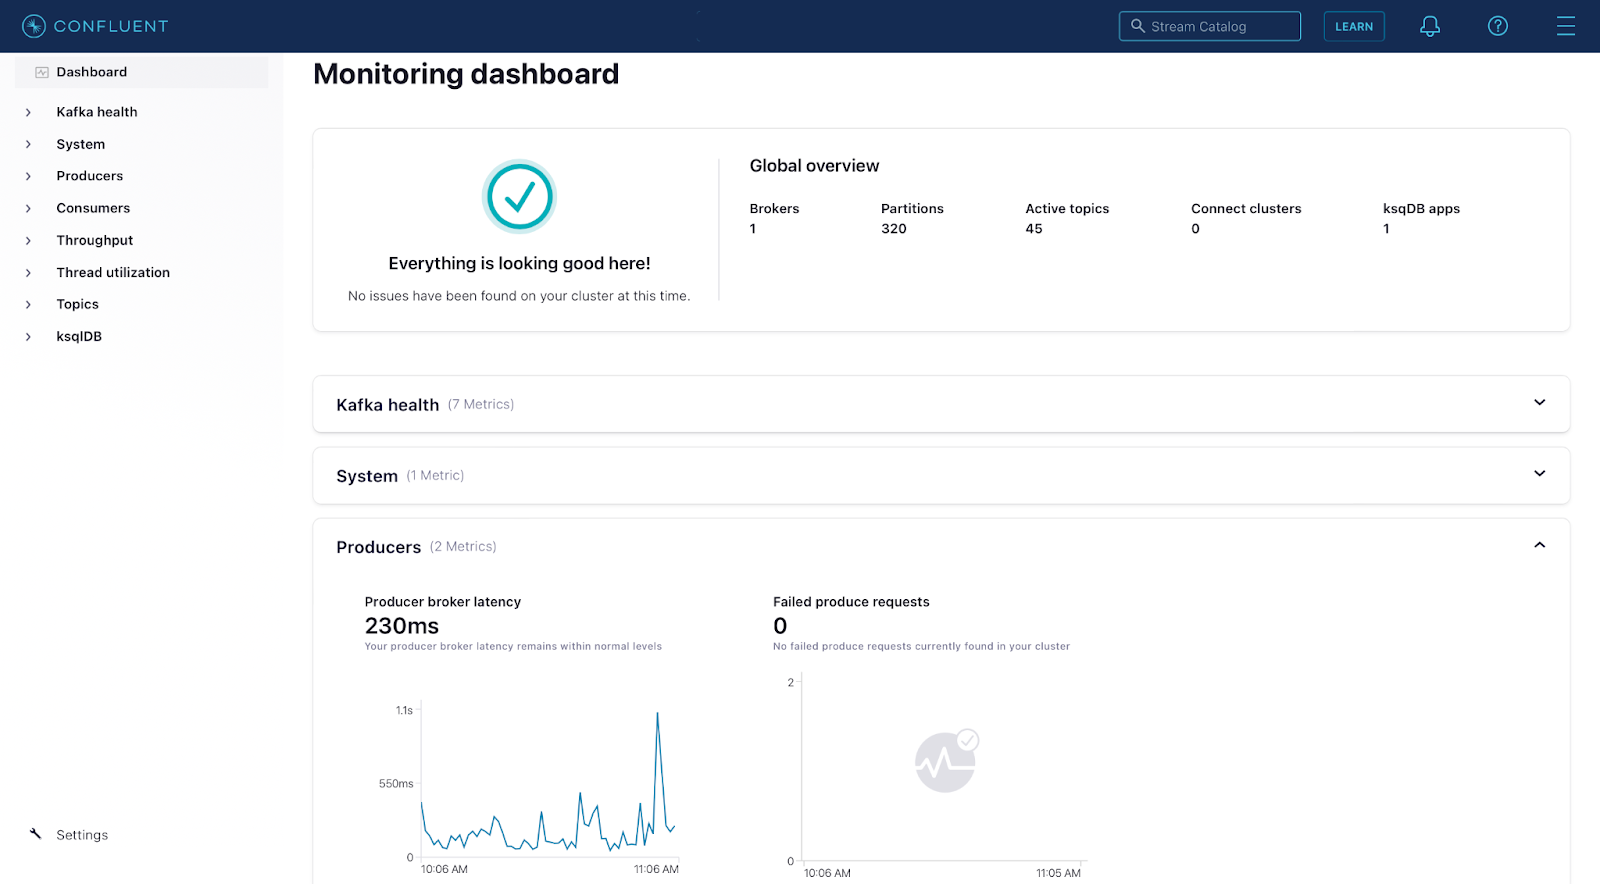
Digging deeper into a metric gives you a variety of helpful insights. You can observe the metric over different time periods to see when an issue began, then compare it against historical trends and other metrics. When Health+ detects that a metric is trending down, it automatically shows you additional information to help explain what the metric means, then offers proactive steps for addressing the underlying issue.
An unhealthy cluster
Finally, this isn’t the end of the road with regard to the Health+ roadmap—we’re constantly iterating and adding more features and metrics to the interface. And you’ll see Health+ automatically upgrade on your end without any additional action or configuration needed.
How does Health+ work?
Health+ comes bundled with your Confluent Platform and it works by sending in telemetry info from each of your components. Telemetry Reporter gathers monitoring data from each Confluent Platform component and sends it via an encrypted HTTPS connection to our Telemetry Collector hosted in Confluent Cloud.
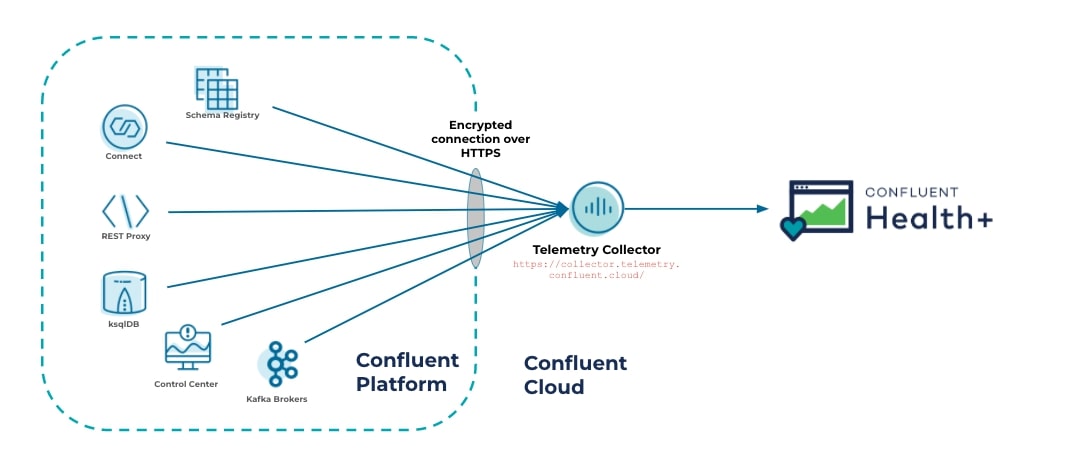
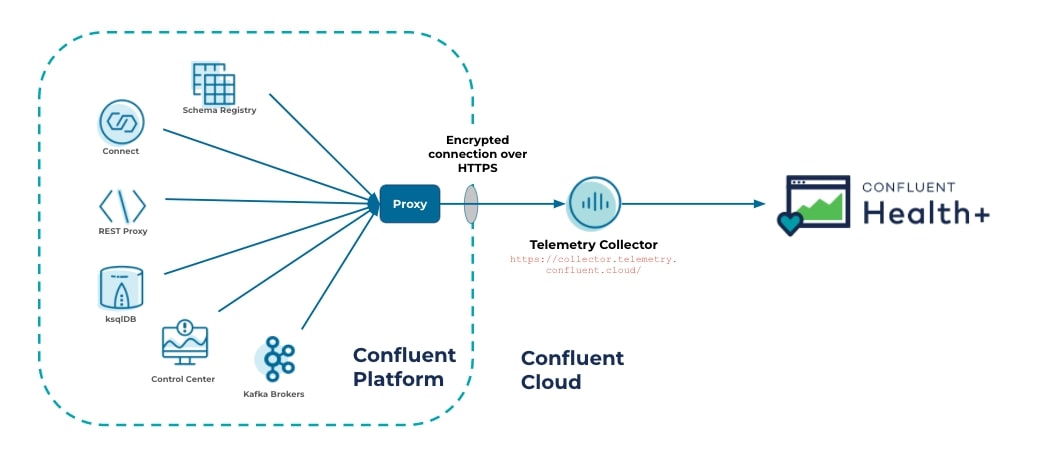
Similar to other cloud-hosted monitoring tools, setting up Health+ requires allowing for outbound traffic from your Confluent Platform components to enable the telemetry data to be sent. For ease of setup, the Telemetry Reporter also supports routing traffic through a proxy with only outbound access allowed.
 What data is sent to Confluent when using Health+?
“Data” can be broken into two main categories:
- Message content refers to data sent to and stored on Kafka topics. This is the message-level data your organization processes using applications that are built on top of Kafka.
- Telemetry data refers to data about the health and operational status of your Kafka services. This data doesn’t contain any message content. This information is typically requested by Confluent’s Support Team when troubleshooting an issue with you.
All data captured by the Telemetry Reporter is thoroughly detailed in our documentation. Each metric that we capture is accompanied by a description of the metric, along with the version of Confluent Platform from where we started capturing.
What about other security questions/concerns?
We built Health+ with the utmost security-conscious customer in mind and understand you or your Infosec team may have questions. Confluent Health+ FAQs have helped many of our customers address most of the common questions with regards to the type of data we collect, the frequency of collection, and the security protocols we have in place to make sure that we only collect telemetry data. If you have additional questions not addressed in this document, please reach out to our support team at support@confluent.io.
Getting started with Health+ is easy
Getting started with Health+ is free and just a few clicks away. When you sign up for Health+, you’ll quickly be guided through the necessary steps to generate your secure credentials and set up the Telemetry Reporter on each of your Confluent Platform components. Get started today and say goodbye to endless troubleshooting and costly downtime.
Did you like this blog post? Share it now
Subscribe to the Confluent blog


Customer Intelligence Hub: A Single Pane of Glass for Customer Insight and Action
Customer Intelligence Hub unifies customer signals into a real-time, AI-powered view that helps GTM teams prioritize risk, identify opportunity, and act faster with contextual insights.