New in Confluent Cloud: Making Data & Pipelines Accessible for AI-Ready Streaming | Learn More
Using ksqlDB for Real-Time Lead Management and Reporting at Leadnomics
How do you continuously process half a terabyte of data in real time? That’s the exact question we had to answer.
Leadnomics is a digital marketing company that helps companies maximize their leads, signups, sales, app installs, or any other action that’s essential to growing their brand. Our organization sifts through thousands of leads each day and intelligently pairs the ideal seeker and provider based on geographic, demographic, and psychographic properties to agents, carriers, advertisers, and publishers. To provide a better experience for our customers, we were tasked with building Leadnomics Edge: our Affiliate & Lead Management platform, which would track leads and manage affiliates within the channel to better promote the growth of our customers’ brands. Like on any good quest, we were tasked with many major requests, but one in particular was absolutely crucial: powerful reporting that could process half a terabyte of data, as close to real time as possible.
Our quest started with one major hurdle. Our original technology partner, whose real-time SaaS marketing platform was supposed to be the backbone of Leadnomics Edge, had just suffered a major security breach. So we decided to build an entirely new platform from the ground up, with just a team of four—a backend engineer (me), a front-end engineer, a product manager/QA, and our COO. We set to work to build a secure platform with real-time reporting.
One request to rule them all
A “request”, as far as Leadnomics Edge is concerned, is essentially session data representing who the user is and what they have done or are doing. We have two “versions” of a request: one a historical timeline of every event that makes up the request, and one a full “merged” object. Is “request” the best term for this? Probably not. Did we spend more time trying to figure out what to call it than we did building it? I’ll never tell. Let’s take a look at what this means in practice:
Example “History” of Request:
{
		"id": "abc123",
		"source": 2,
		"ipaddress": "123.456.1234",
		"useragent": "Chrome",
		"domain": "somewhere.net",
		"clicks": "+1",
		"impressions": "+5",
		"price": 2.45
	}

--- X minutes later
	{
		"id": "abc123",
		"clicks": "+3",
		"impressions": "+2"
	}
--- X minutes Later
	{
		"id": "abc123",
		"impressions": "+2",
		"uptick": 4.50
	}
Example “Merged” Request:
{
		"id": "abc123",
		"source": 2,
        "created_at": FIRST_TIMESTAMP,
        "updated_at": LAST_TIMESTAMP
		"ipaddress": "123.456.1234",
        "geo":{
		  ...geolocationdata
		}
		"useragent": "Chrome",
        "UA": {
           ...Data derived from UA parsing
        },
		"domain": "somewhere.net",
		"clicks": 4,
		"impressions": 9,
		"price": 2.45,
        "uptick": 4.50,
	}
This is a very simple example, but it illustrates three of the most common processes involved in a request merge: processing metadata from certain fields (such as geolocation from ipaddress), field incrementing, and an object merge. Our goal is to take these streams of requests, group them by their ID, and then send them along to be both merged and stored. So, where do we begin?
Life, liberty, and the pursuit of merging data
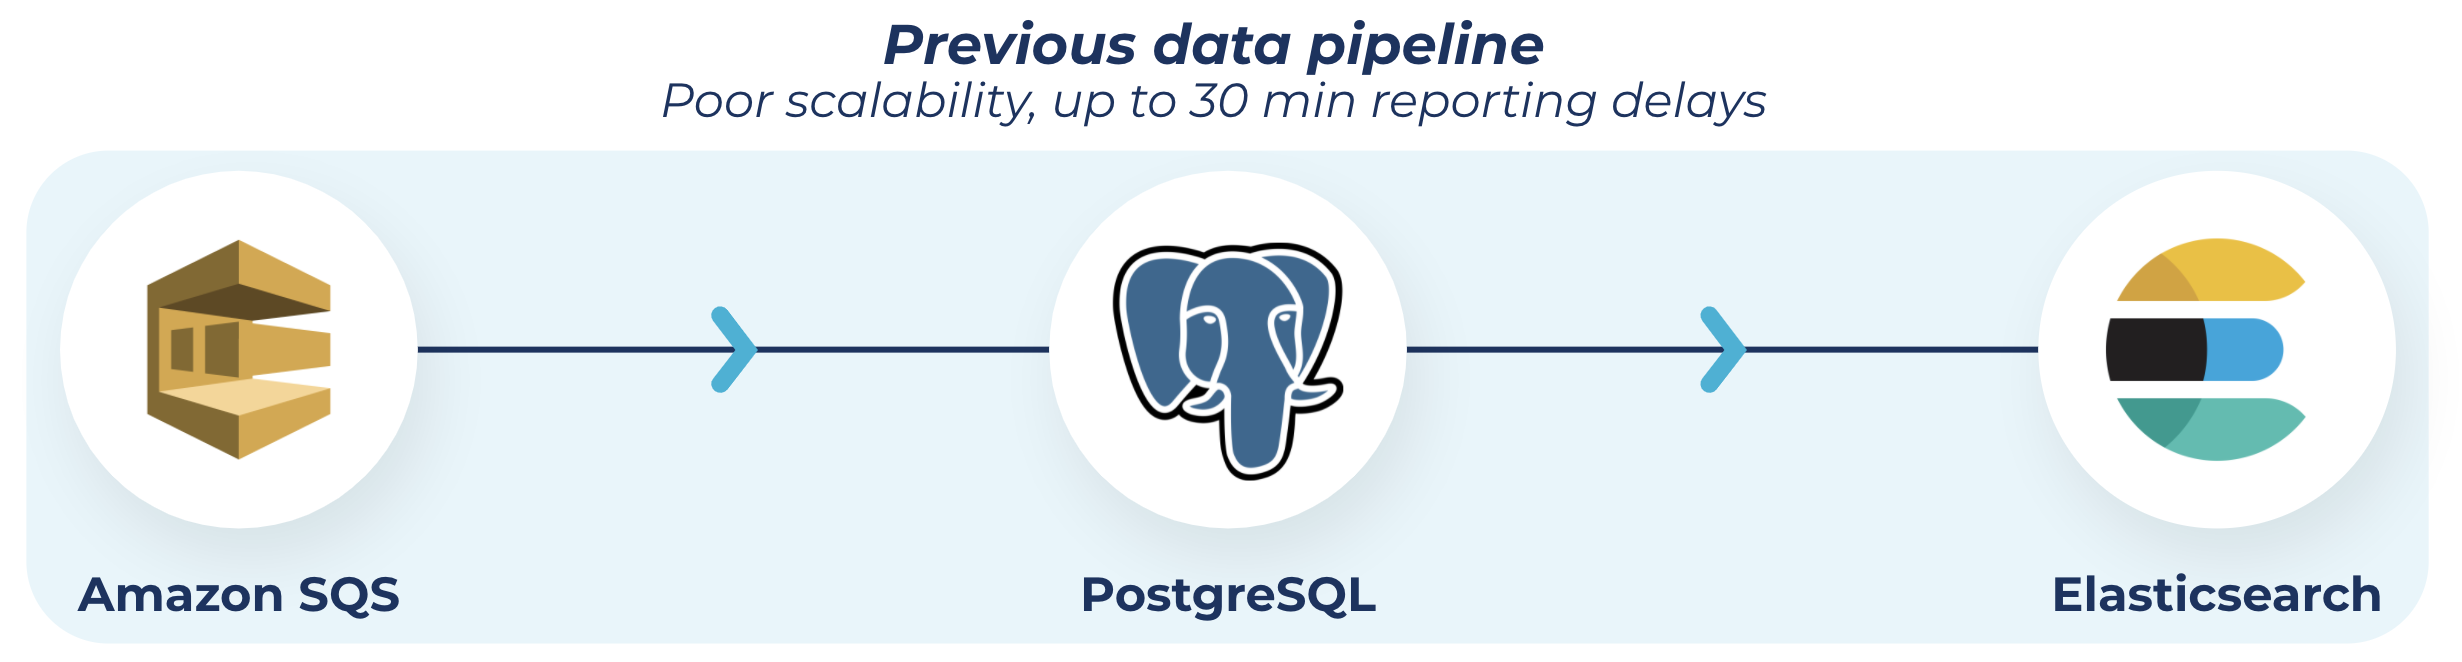
Our first attempt uses AWS SQS, a PostgreSQL database, and Elasticsearch. Our reasoning for this was based mostly on our experience, familiarity, and previous success with these tools. Each request is pushed into the queue, where it’s picked up by a worker to be stored in the Postgres database. After that, a second worker reads from the database, groups the requests by ID, and performs the merge and load to Elasticsearch.
I see those of you in the back with your hands raised and mouthing the word “scale” over and over. Put your hands down and stop skipping ahead, though you are correct.
This method functioned fairly well for a while and gave us an average reporting delay of about 2 minutes. Not ideal, but ahead of a lot of our competition!
Harry Potter and the database on fire
Life was good, birds were singing, and the weather was always a crisp clear 70 degrees (except when it was raining donuts like in that one Simpsons episode).
Then scale happened.

Source: “The IT Crowd”
Some of the more experienced developers reading this may have seen this coming (and were shouting at me since the last section). That’s OK. Keep yelling, I still love you. We’re all gonna work this out together.
As our traffic started to scale, our infrastructure started to buckle, and our reporting delay started to grow: 3 minutes, 5 minutes, 15 minutes, 30 minutes.
Our main pain point here was the database. As the table grew, the number of requests increased, as did the size of individual requests, and query time continued to grow and grow. We had all the information we needed with Elasticsearch, but it just wasn’t loading as fast as we wanted. Queue sleepless nights as we attempted to put out the database on fire.
Table optimization, query tweaking, and scaling the database all helped, but also felt like Band-Aids, and not the cool Star Wars ones, just regular Band-Aids. We needed a new solution, and I needed a reason to stop tweaking database configurations at 2 AM.
How ksqlDB saved my sleep schedule
After many long hours of discussion in our war room (Slack channel), we came across our new solution: we would replace SQS and PostgreSQL with Apache Kafka® and ksqlDB respectively. We had had a lot of success using Kafka at previous companies to manage much of our logging. That, combined with how promising our first look at ksqlDB was, drove our final decision. To be honest, we had never used Kafka before at Leadnomics, but we heard about the benefits of the technology from a developer at our sister company. So I did some research and discovered Confluent Cloud, which would allow us to utilize all of Kafka’s capabilities but without any operational overhead. I started playing around with Confluent and ksqlDB to see if it would do what it advertised. Turns out, it did!
Our queue is replaced by a Kafka topic on Confluent Cloud. The Kafka Node Module made this an extremely painless swap.
So now that we have requests flowing through our Kafka topic, we have two more things we want to do: Push the data to storage, and push the data to be merged and published to our reporting. Again, keep in mind that this is all done on Confluent Cloud, making this an extremely painless process.
The first step is pretty simple. We push the data from the Kafka topic into an S3 sink, to be stored by ID.
Next, we group requests by ID and send them to our worker. ksqlDB makes this a breeze, with an SQL-like interface. (Do you think that’s why they called it ksqlDB? Clever clever.) Plus, all you really need to know is SQL, and that makes learning the product pretty straightforward. It also doesn’t hurt that there is quite a bit of documentation out there. All I needed to do was write a query and learn the new syntax.
Here’s an example ksqlDB query we used:
CREATE TABLE EDGE_REQUESTS_GROUPED WITH (KAFKA_TOPIC='<TOPIC>', PARTITIONS=<PARTITIONS>, REPLICAS=<REPLICAS>) AS
SELECT
  EDGE_REQUESTS.ID CLIENT_REQUEST_ID,
  COLLECT_LIST(EDGE_REQUESTS.REQUESTS) REQS
FROM EDGE_REQUESTS EDGE_REQUESTS
GROUP BY EDGE_REQUESTS.ID
EMIT CHANGES;
Once our query is running, we connect our worker to our cluster (again, the module makes this smooth), start our merge, and publish to Elasticsearch.
All right, now let’s take a look at our reporting delay. Have we gotten ourselves back down to that 2 minute benchmark?
Reporting Delay: 10 seconds.
So what changed? ksqlDB changed the way we were rolling up requests. Previously, we were using Postgres, and the queries were taking 20-30 seconds. ksqlDB allowed us to do these roll-ups instantaneously. So with Postgres DB, we threw out an entire layer of hardware (which we know is always good). And voila! Latency between the separate request and grouped request became a non-factor. Without ksqlDB, our platform likely would have had a 10-15 minute delay. Now, it’s truly real-time.

Results? Secure platform, check. Real-time report, check. Quest complete, mission accomplished. In short, ksqlDB was the magic we needed.
Thanks to ksqlDB and Confluent Cloud, we have lowered our delay beyond even our initial best expectations. Plus, we launched an entire new platform in just eight months, with our scrappy team of four. Now we have happy customers, happy bosses, and well-rested engineers. Thanks, ksqlDB! I’ll dream about you as I sleep through the night. Next quest, how to leverage ksqlDB and Confluent Cloud for our machine learning use cases.
If you’d like to try Confluent Cloud for yourself, get started with a free trial and use the code CL60BLOG to get an additional $60 of free usage.*


