[Virtual Event] Agentic AI Streamposium: Learn to Build Real-Time AI Agents & Apps | Register
Measuring and Monitoring a Stream Processing Cloud Service: Inside Confluent Cloud ksqlDB
While preparing for the launch of Confluent Cloud ksqlDB, the ksqlDB Team built a system of metrics and monitoring that enabled insight into the experience of operating ksqlDB, the associated challenges and limitations, and its performance under different workloads.
Stream processing systems, such as ksqlDB, are notoriously challenging to monitor because:
- They are distributed.
- They often have multiple dependencies or potential points of failure, including external datastores, schema stores, and aggregation state stores.
- Their expected performance characteristics depend on factors outside the system provider’s control. For example, the type of processing (filters, aggregations, joins, etc.) and the data being processed (e.g., message size and throughput characteristics).
Stream processing cloud services face additional monitoring challenges stemming from the complexity of container orchestration and dependencies on cloud service providers. Put that all together, and you’ve got a sense of what the ksqlDB Team has faced while developing Confluent Cloud ksqlDB, our hosted stream processing solution.
Our system of automated alerts allow the Confluent Cloud ksqlDB team to keep the service running smoothly. In what follows, I share our strategy for monitoring and alerting in Confluent Cloud ksqlDB and some lessons learned along the way.
This is the third is a series of posts on enhancements to ksqlDB to enable its offering in Confluent Cloud. For the first and second posts, check out ksqlDB Execution Plans: Move Fast But Don’t Break Things and Consistent Metastore Recovery for ksqlDB Using Apache Kafka® Transactions.
To begin, there are three requirements for any successful system of monitoring and alerts. An effective system should allow operators to:
- Respond promptly when things go wrong
- Proactively mitigate potential issues
- Have confidence that the absence of alerts means things are running smoothly
Goal 1: Respond promptly when things go wrong
In order to respond, we first have to know when something goes wrong.
What does it mean for something to go wrong? One starting point is the Confluent Cloud ksqlDB SLA, which states that provisioned ksqlDB instances should be able to receive metadata requests. Essentially, ksqlDB instances should be up and available.
In order to monitor ksqlDB instance availability, a health check instance is deployed alongside each Confluent Cloud ksqlDB cluster. The health check sends lightweight metadata requests to the ksqlDB cluster and reports whether the requests succeeded or failed. If the number of failures over some timespan exceeds a threshold, the ksqlDB Team is alerted and responds promptly, regardless of the time of day.
Besides the guarantees of the SLA, other expectations of a ksqlDB instance include that persistent queries continue running and processing data, created API keys can be used to authenticate with the ksqlDB server via its REST API or the ksqlDB CLI, users may issue transient queries and other types of requests, and performance as measured by processing throughput. Expectations for the Confluent Cloud ksqlDB service itself include the ability to provision new ksqlDB instances, de-provision existing ones, create API keys for existing instances, and access instances via the Confluent Cloud UI. These additional expectations are important to the usability of Confluent Cloud ksqlDB and the team monitors and alerts on them as well.
Besides being alerted when something has gone wrong, it’s important that the alerts allow the team to quickly remediate any potential issues. This means the alerts must be specific so a responder can focus on repairing the issue, rather than spending time diagnosing it. This is especially important for a complex service such as ksqlDB, as failures can occur for many different reasons: The issue could be within ksqlDB itself, the underlying Kafka cluster, the network connection between ksqlDB and Kafka, the associated Confluent Schema Registry cluster, the Kubernetes cluster in which ksqlDB is deployed, or due to resources from the cloud service provider. Monitoring must be configured at each level to allow for specific alerts. For example, “the ksqlDB server is up and the underlying Kafka cluster appears normal, but ksqlDB is failing to send requests to Kafka” is more readily actionable than “ksqlDB is failing to list topics.”
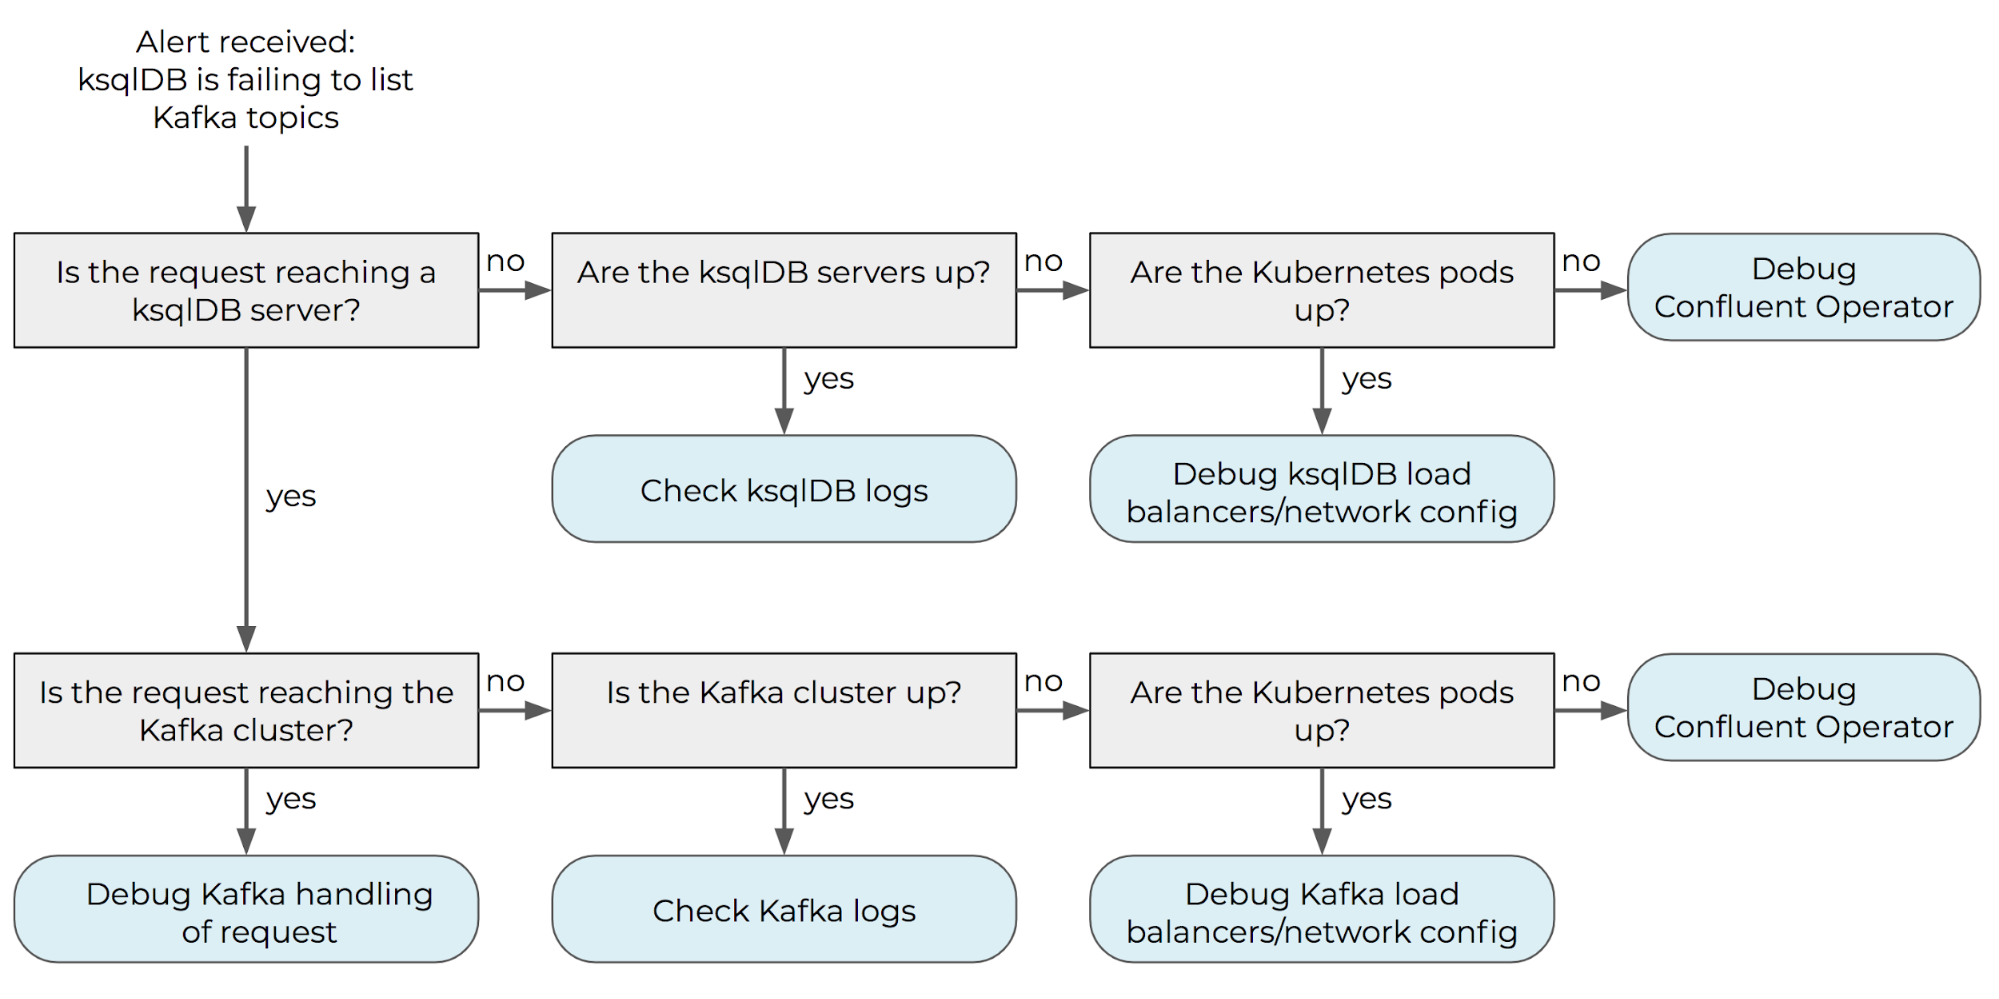 Monitoring should be configured at each level of the system in order to automatically answer the questions in the gray boxes. In this way, the alert can be automatically associated with a specific response (represented in blue), allowing for speedy triage and remediation.
Another important distinction that must be reflected in the monitoring system is whether failures are due to system failures or user errors, as the ksqlDB team can act to repair the former but not the latter. For example, if a persistent query stops processing data because it has encountered an error within ksqlDB, the team should be alerted in order to respond. In contrast, if a persistent query stops processing data because the user deleted the source topic for the query, the monitoring system should not alert the ksqlDB Team as there is no action needed from the team—besides exposing the reason for the failure to the user, which is best done in product automatically. Distinguishing between system and user errors in this way requires a different type of alert specificity.
Goal 2: Proactively mitigate potential issues
While alerts that fire when failures have occurred are important, they alone are not enough to keep a service such as Confluent Cloud ksqlDB running smoothly. It’s also important to monitor secondary metrics that don’t directly answer the question, “Is the service up?” but are related and may indicate problems to come. Example metrics include memory usage, CPU usage, and disk utilization.
Disk utilization is important because ksqlDB stores state for stateful queries in RocksDB, which spills to disk if the state does not fit in memory. If a ksqlDB instance runs out of disk space, persistent queries will stop processing data. By monitoring disk utilization, the ksqlDB Team can proactively notify users before this happens. Users may then prevent the failure by resizing the ksqlDB cluster to have more nodes and more disk as a result. (In the future, we’d like to offer autoscaling to avoid the need for manual intervention by the user in such scenarios.) These alerts are most effective if instead of configuring a threshold alert on current disk utilization, the alerting logic also accounts for the trajectory of growth in disk utilization over time.
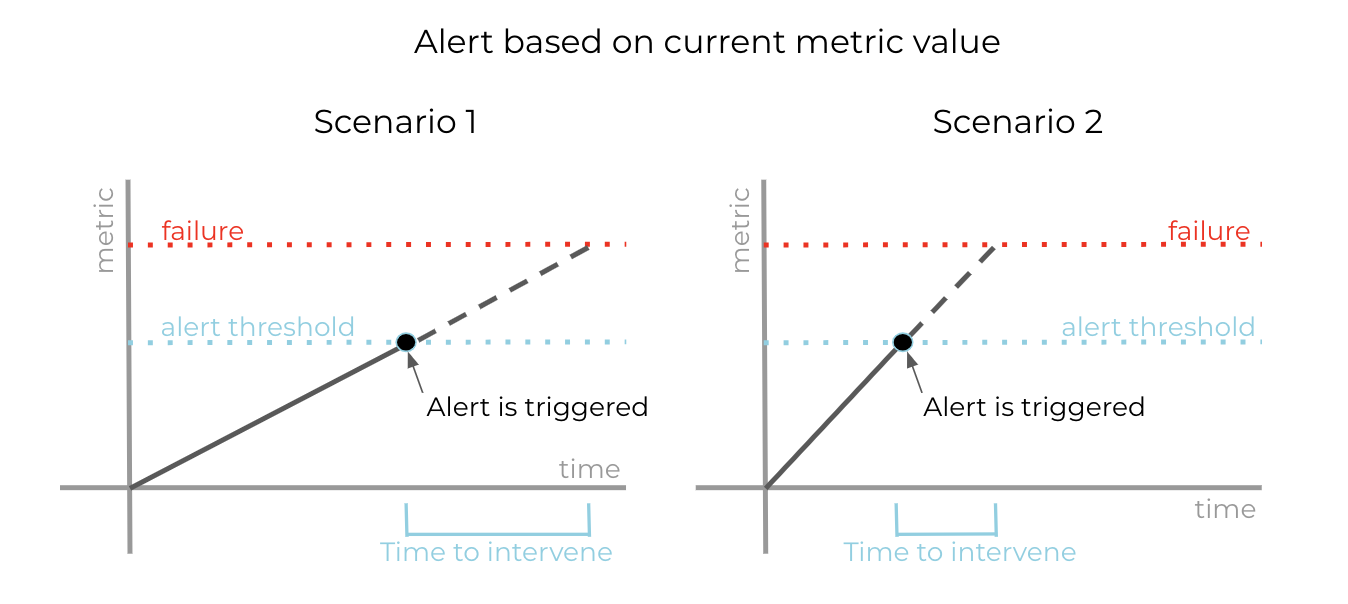 Threshold alerts based purely on the current metric value may not leave enough time to intervene and prevent failure in all scenarios.
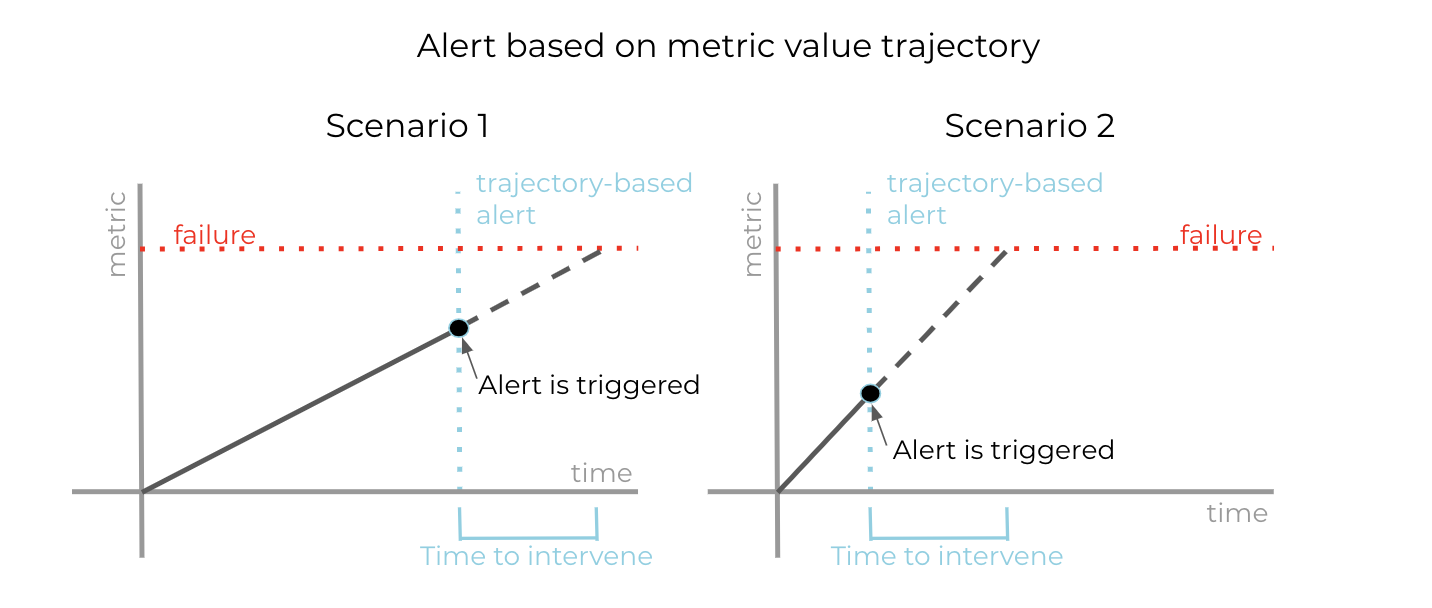 By additionally taking the trajectory of the metric value into account, alerts can be configured to more reliably leave enough time to intervene and prevent failure in different scenarios.
Goal 3: Confidence that the absence of alerts means things are running smoothly
Besides ensuring that the system for monitoring and alerts covers potential failures in the service of interest and that alerts are specific and readily actionable in order to allow for prompt response, it’s also necessary for the monitoring and alerting system to catch potential failures within the monitoring and alerting system itself. This is key to ensuring that alerts will fire whenever something has gone wrong. Otherwise, we cannot be confident that everything is running smoothly in the absence of alerts, as it’s possible a failure has occurred in the monitoring and alerting pipeline.
Consider the health check alert mentioned above as an example. If the proportion of health check failures over some time period exceeds a predefined threshold, an alert is fired as the ksqlDB instance is likely unavailable. An additional “health check no data” alert fires if the health check stops emitting data, as this indicates a problem with the health check that prevents the health check alert from firing even if the ksqlDB instance is unavailable. Alerts must also catch the case where health check data is missing, not because the health check stopped emitting metrics but because the health check service failed to provision.
The Confluent Cloud ksqlDB monitoring and alerting pipeline contains other forms of redundancy as well. By having ksqlDB instances report metrics to two different metrics services, the system is able to catch failures that may occur in either pipeline. Additionally, a metrics check service validates consistency among the three sources of data: two metrics services and the database where ksqlDB cluster creation, update, and deletion requests are recorded.
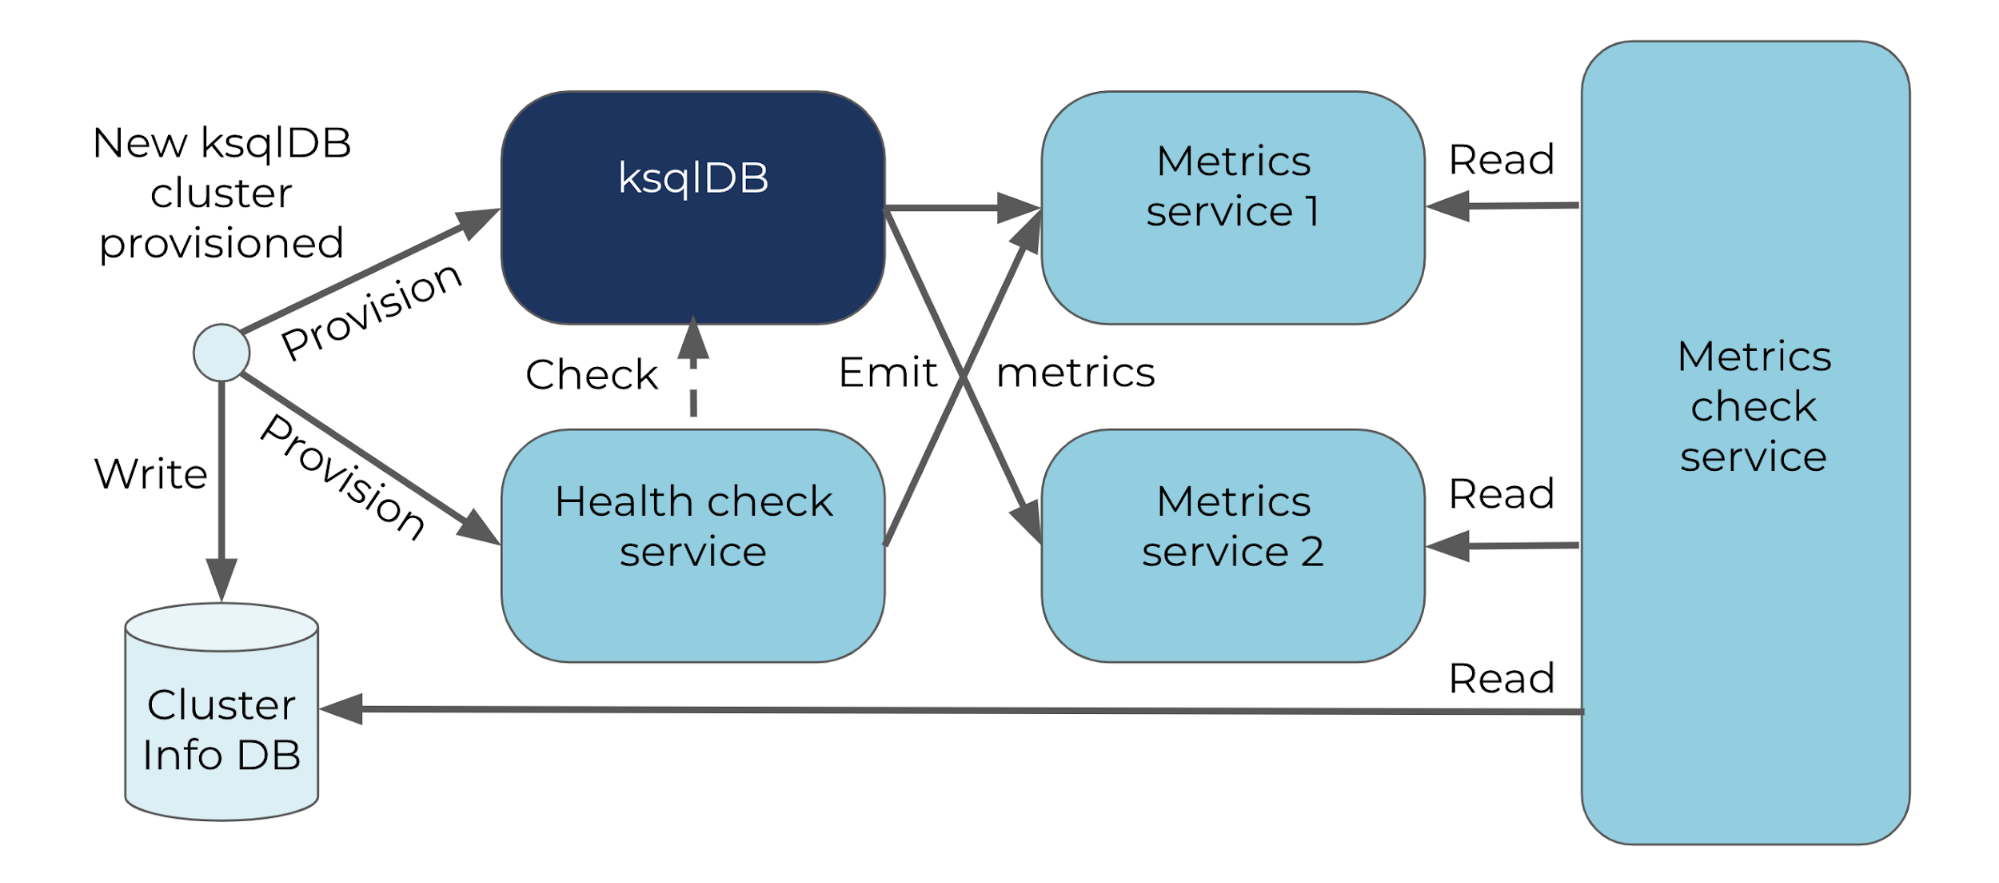
The Confluent Cloud ksqlDB metrics and alerting pipeline has redundancy in order to catch potential failures in the metrics and alerting pipeline itself, which could otherwise mask ksqlDB service failures.
Lessons learned
Prior to the launch of Confluent Cloud ksqlDB, the associated monitoring and alerting pipeline underwent numerous iterations before it was deemed ready for the launch. Here are a few recurring themes in the lessons we learned along the way.
Metrics should be fine grained
As an example, consider monitoring and alerting on failures during the provisioning of a new Confluent Cloud ksqlDB cluster. If it’s been a long time since a new cluster began provisioning and the provisioning still has not completed, we need fine-grained metrics to inform where the provisioning process is stuck.
Did the request reach the relevant Kubernetes cluster? Was Kubernetes able to acquire the necessary resources (nodes, disk, load balancer, IP addresses, etc.) for the new cluster? Were the ksqlDB servers able to start? Was the health check able to connect to the servers?
Monitoring pipelines should support propagating information about failures in both directions along the dependency chain
Suppose a ksqlDB server fails to start because of missing ACLs required for connecting to Kafka. It’s important that this information about the failure is propagated in both directions along the dependency chain. In particular, the cause of the failure must be bubbled up the chain from ksqlDB to the Confluent Cloud UI in order to inform the user of an action they can take to allow ksqlDB to finish provisioning: Configure the required ACLs. It’s also important that certain types of failures are propagated down the dependency chain from the ksqlDB instance to the Confluent Cloud ksqlDB service in order to, for example, temporarily disallow the provisioning of new ksqlDB clusters in certain cloud provider regions, if the cause of provisioning failure is likely to impact all new clusters in the region.
Invest in avoiding alert fatigue
While a new ksqlDB cluster is provisioning, the health check service will record failures for its attempts to send metadata requests to the ksqlDB instances as the ksqlDB servers are not yet available to serve requests. However, the health check alert that normally fires when health check failures are recorded should not trigger in this case as the cluster is not yet fully provisioned, and metadata requests are expected to fail as a result. Preventing spurious alerts is important for avoiding alert fatigue, where a large volume, particularly of inactionable alerts, hurts the signal-to-noise ratio and makes it difficult to respond promptly.
Correlated alerts should ideally be reduced to a single alert. An oscillating health check should not trigger a new alert on each oscillation. A temporary unavailability for a single Kafka cluster should not trigger a separate alert for each ksqlDB cluster provisioned against the Kafka cluster. A failure in the metrics pipeline should not trigger a separate “no data” alert for each metric.
Collect metrics, metrics, and more metrics
Finally, collection of metrics is necessary not only for configuring alerts but also benchmarking, a requirement for understanding and communicating expectations, and also the first step toward improvement. By understanding how much time is spent in each step of the provisioning process, we can fine tune alerts for each step based on expectations and also communicate expectations to users. The ksqlDB Team has also found it useful to collect metrics about the alerts we receive: the type of alert, how long it took to respond, whether the alert was actionable, the root cause of the issue, and so on. These metrics are key to continuously improving our monitoring and alerting pipeline.
Future work
No system for alerts and monitoring is perfect on the first attempt. In addition to improving responsiveness and reducing spurious alerts for the Confluent Cloud ksqlDB Team, we’ve also got a number of user-facing improvements in the works:
- Defining an uptime metric for persistent queries, including the relevant monitoring and a formal SLA definition
- Defining an availability metric for pull queries, including the relevant monitoring and a formal SLA definition
- Exposing user-facing metrics via the Confluent Cloud Metrics API so users can also benefit from insights into the performance of their ksqlDB cluster and queries, and configure their own monitoring and alerting as well
- Automating the resizing of clusters in response to changes in resource utilization, including providing knobs to users to control this behavior
Try with confidence
Learn more about ksqlDB and try it hosted in Confluent Cloud today with confidence that the ksqlDB Team has got your back. If you have any questions, join the community and share your thoughts in the #ksqldb Slack channel.
Further reading
Did you like this blog post? Share it now
Subscribe to the Confluent blog
Why ELT Can't Keep Up in the Era of High-Scale Data Engineering
Batch ELT pipelines create duplication, cost spikes, and governance gaps as data scales. Here’s why enterprises are rethinking legacy integration models.
How to Protect PII in Apache Kafka® With Schema Registry and Data Contracts
Protect sensitive data with Data Contracts using Confluent Schema Registry.

