[Virtual Event] Agentic AI Streamposium: Learn to Build Real-Time AI Agents & Apps | Register
Measuring Code Coverage of Golang Binaries with Bincover
Measuring coverage of Go code is an easy task with the built-in go test tool, but for tests that run a binary, like end-to-end tests, there’s no obvious way to measure coverage. A blog post published by Elastic presents a clever solution to this problem, but it doesn’t include a ready-to-use, generic solution.
At Confluent, many of our system and integration tests are written in Go. In addition, our code needs to be robust enough to handle panics and OS exits, and products like the Confluent CLI and Confluent Cloud CLI, which are written in Go, need to parse command line arguments. Until we wrote Bincover, there was no tool to measure binary coverage that satisfied these requirements and could be easily integrated with our existing code.
We’ve open sourced a tool called Bincover, which solves this problem by providing a simple and flexible API that generates an “instrumented binary” that can measure its own coverage, runs it with user-specified command line arguments and environment variables, and merges coverage profiles generated from multiple test runs. This deep dive covers how we’ve implemented Bincover and shows a demo on how to use it to measure the coverage of a simple Go application.
Generating an instrumented binary
The main idea behind measuring Go binary coverage, introduced in the previously mentioned Elastic blog, is to create a file with a “fake” test that runs the main method of the application. This test is then compiled using a build tag to prevent the file from being included in the package when built normally, and the resulting instrumented binary is executed to generate a coverage profile.
It’s as easy as it sounds:
// +build testrunmainpackage main
import ( "testing" )
func TestRunMain(t *testing.T) { main() }
Unfortunately, instrumenting a binary in this way is too simplistic for several reasons. For one, it’s impossible to pass in command line arguments, which for products such as the Confluent CLI is critical. Furthermore, if your application exits with panic or with os.Exit(code int), go test won’t collect coverage information. This is problematic for applications that exit with a non-zero exit code by design, like a CLI when an invalid command is run.
Bincover handles all of these problems while requiring no additional lines of code to do so:
// +build testbincover

package main

import (
      "testing"

      "github.com/confluentinc/bincover"
)

func TestBincoverRunMain(t *testing.T) {
       bincover.RunTest(main)
}
The above file can be compiled with go test ./path/to/main-function -tags testbincover -coverpkg=./... -c -o instr_bin. Linker flags can be specified with -ldflags="path/to/main-function.key=value". Including the package name is necessary when adding linker flags in tests, since go test renames the package being tested and passes the value to a nonexistent package if the full name isn’t specified. A detailed discussion on this topic can be found in this golang-nuts thread. Note that you can rename TestBincoverRunMain and the build tag as desired.
Now that we’ve explained the general approach of how Bincover instruments a binary, let’s see how Bincover can be used to measure coverage of an actual Go application.
Bincover example application
If you’d like to see the example application’s directory structure, the above file can also be found in the Bincover repo.
All this application does is take a command line argument and echo it back, exit with an error if no arguments are provided, or panic if more than one argument is provided. Technically, coverage can be measured here without Bincover by manually setting os.Args in test cases and running main. For more complex applications, accurately duplicating the behavior of a full binary run becomes increasingly difficult.
Note the isTest variable at the top of the file. We set this variable to true via linker flags when compiling the test binary and use it to determine when to call os.Exit and when to instead set bincover.ExitCode to the exit code. We designed Bincover this way, because unfortunately, there’s no way to intercept os.Exit calls in Go except by monkey patching, which is dangerous and often unreliable. We briefly tried this approach but quickly found that later versions of macOS prohibit accessing protected memory regions by default, and the effort required to investigate and enable this behavior is not worth the small improvement in convenience.
Instrumenting and running a binary in your test suite is as easy as:
- Running a go test command to compile your instrumented binary. This could also be done outside of the test suite, in a Makefile, for example
- Initializing a CoverageCollector
- Calling collector.Setup() once before running all of your tests
- Running each test with the instrumented binary by calling collector.RunBinary(binPath, mainTestName, env, args)
- Calling collector.TearDown() after all the tests have finished
- Actually running the tests with: go test ./examples/echo-arg -v
- Accessing the merged coverage file, named when initializing the coverage collector
Here’s the test code annotated with steps 1–5 from above:
And here’s the actual command that’s executed in step 1:
Looking under the hood
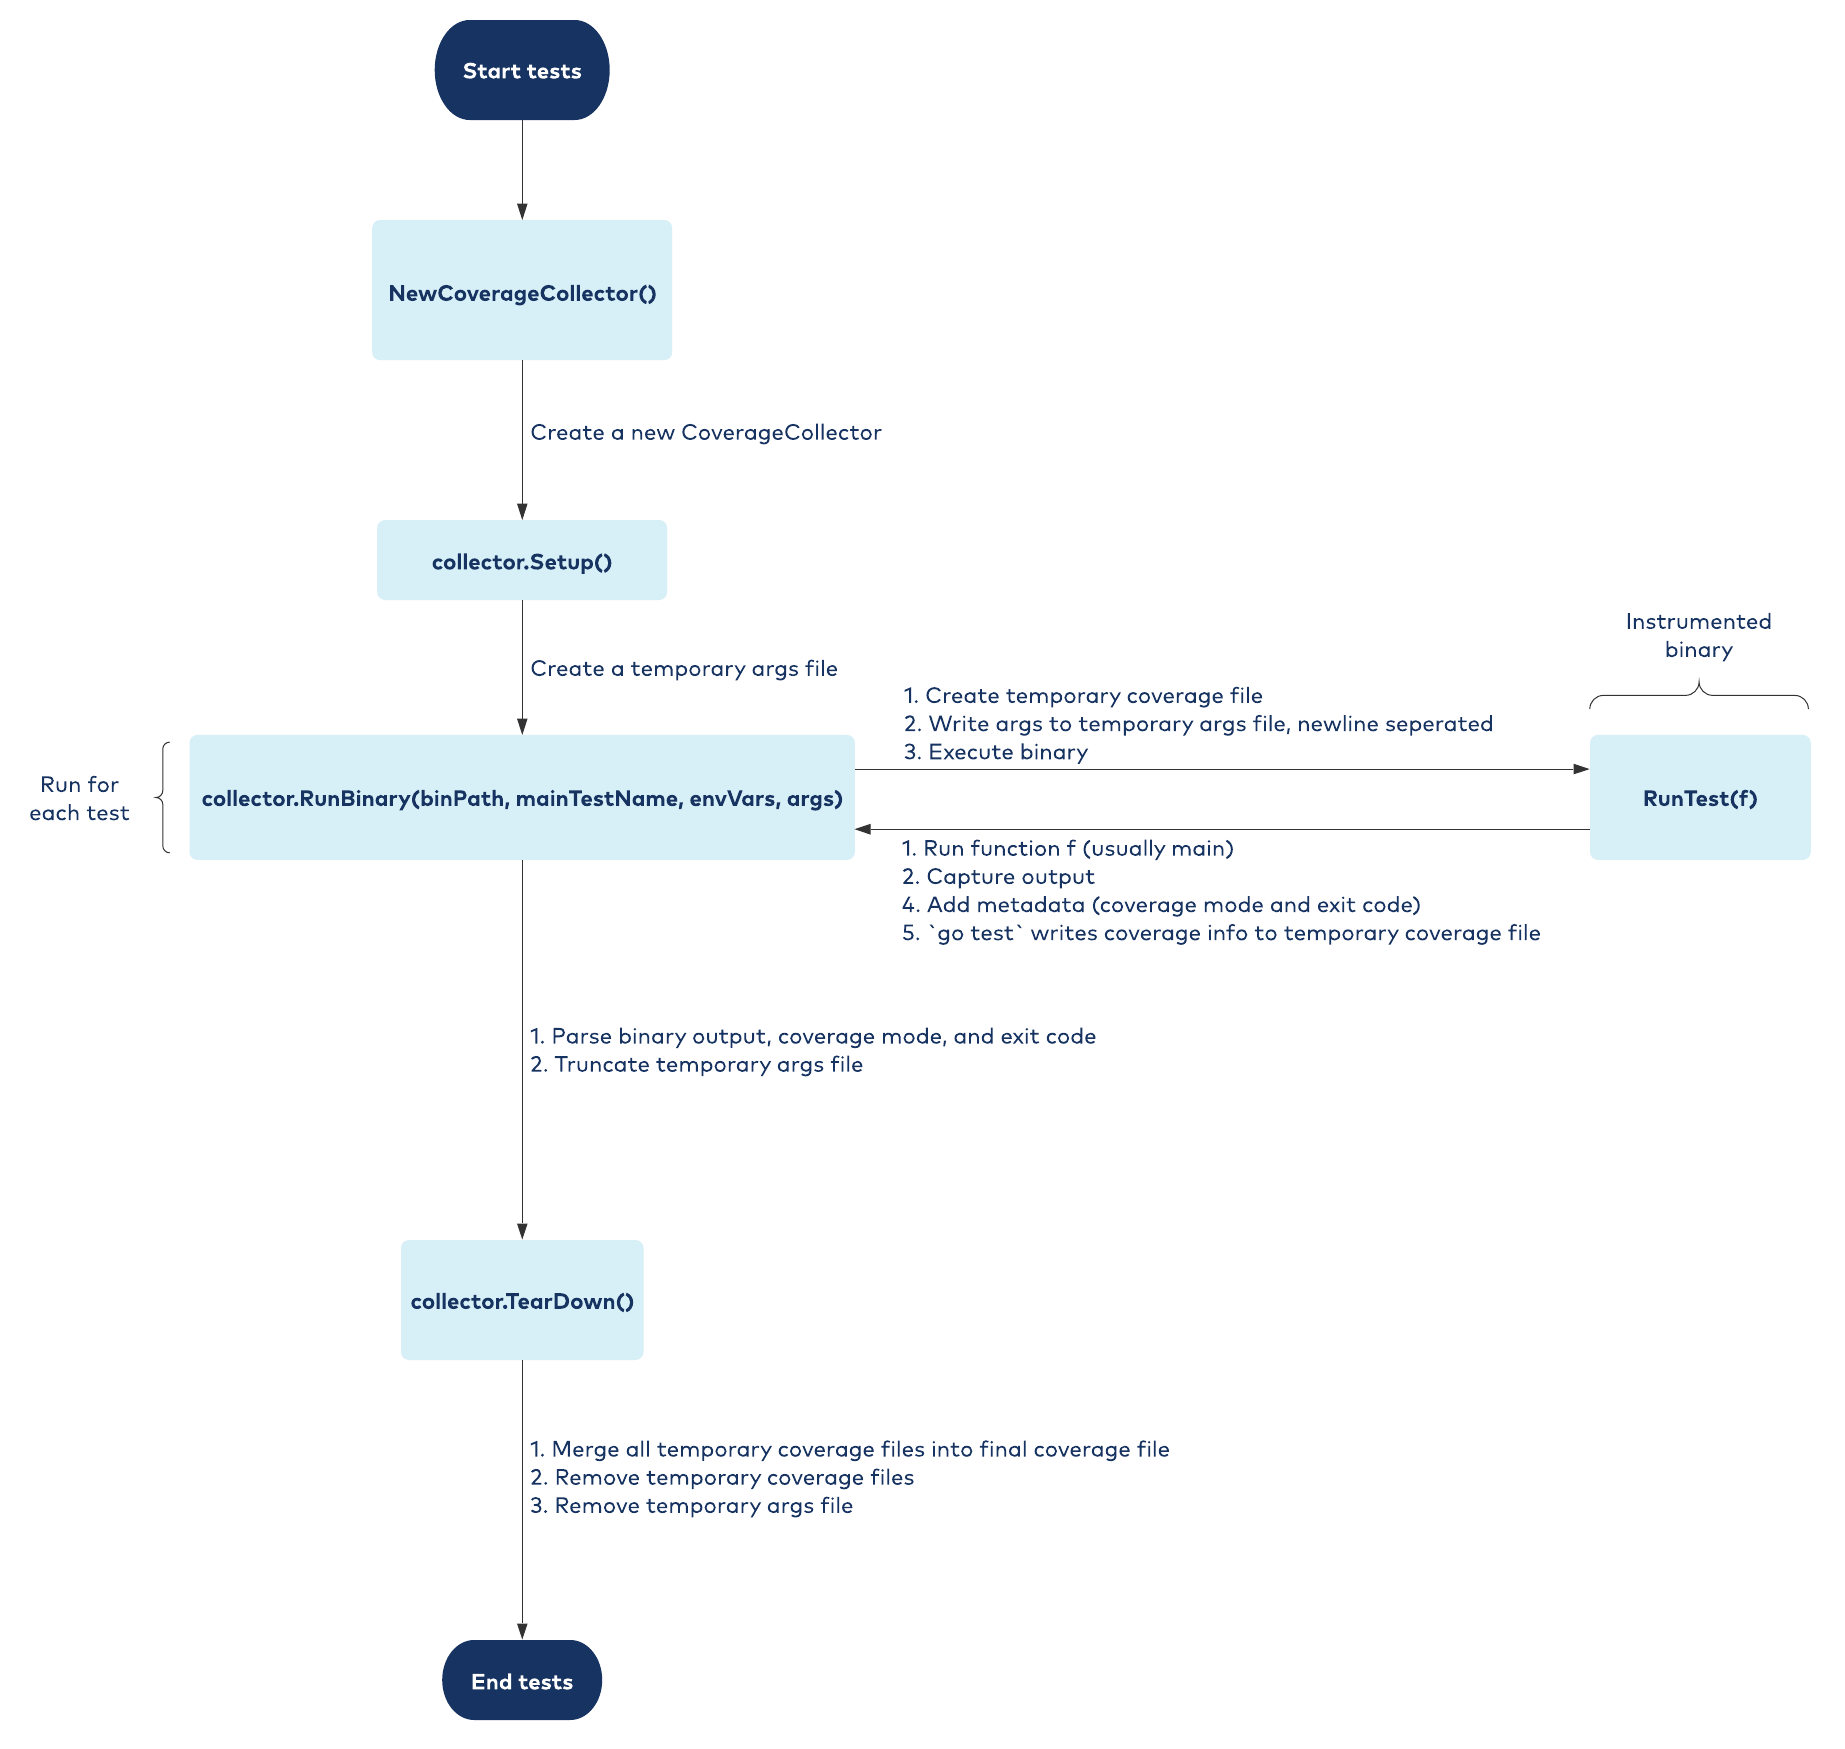
Here’s a diagram that shows how Bincover works under the hood:

Handling command line arguments
Bincover handles command line arguments by first creating a temporary args file in Setup(). At the start of each test when RunBinary() is called, it writes the specified command line arguments to this file, separating them with newlines, and sets an -args-file flag to the temporary args filename. In RunTest(), Bincover parses the arguments specified in the -args-file. After the binary is executed, Bincover truncates the file and deletes it in TearDown().
Collecting coverage
If collectCoverage is set to true, Bincover creates a temporary coverage file, which it passes to the instrumented binary via the -test.coverprofile flag. When the binary executes, it writes coverage information to this file. After all tests are done running and TearDown() is called, Bincover merges all the temporary coverage files into a single file whose name is specified when the CoverageCollector is initialized.
Collecting metadata
In order to return the exit code at the end of RunBinary(), in addition to capturing the exit code via the bincover.ExitCode variable, the cover mode must be collected in the instrumented binary to properly merge the coverage profiles. To transmit this information to RunBinary(), the instrumented binary prints a marker to indicate the start of the metadata, prints the metadata, and then prints a marker indicating the end of metadata. Once the binary finishes executing, Bincover simply looks for these markers in stdout and extracts the output of main() and the metadata.
Exploring further and contributing
If you think Bincover would be useful for you, check it out on GitHub! All the code shown in this blog post is available there, along with a more extensive GoDoc. We’d be happy to hear your suggestions for new features, bug fixes, or improvements to the documentation.
Did you like this blog post? Share it now
Subscribe to the Confluent blog
Integrating AI Into Apache Kafka Architectures: Patterns and Best Practices
Kafka is your event backbone, not your inference runtime. This guide breaks down three patterns for running AI alongside Kafka (external API, embedded, sidecar), when to use each, and how to handle topic design, dead-letter queues, idempotency, and LLM cost control.
Why Real-Time Stream Processing Beats Batch ETL for AI Data Freshness in 2026
Batch ETL feeds AI models data that's hours old. That causes context drift in RAG, training-serving skew in fraud detection, and broken operational AI. This guide covers the Ingest, Process, Serve architecture using Kafka and Flink to keep embeddings, features, and context fresh in milliseconds.

