[Webinar] Master Apache Kafka Fundamentals with Confluent | Register Now
Building a Streaming Analytics Stack with Apache Kafka and Druid
One popular trend in the data world recently is the rise of stream analytics. Organizations are increasingly striving to build solutions that can provide immediate access to key business intelligence insights through real-time data exploration. Architecting a data stack to transmit, store, and analyze streams at scale can be a difficult engineering feat without the proper tools. Luckily, existing open source solutions can be combined to form a flexible and scalable streaming analytics stack. In this blog post, we will use two popular open source projects, Apache Kafka and Druid, to build an analytics stack that enables immediate exploration and visualization of event data. Together they can act as a streaming analytics manager (SAM) that can make a real difference.
Apache Kafka
Apache Kafka is a publish-subscribe message bus that is designed for the delivery of streams. The architecture of Kafka is modeled as a distributed commit log, and Kafka provides resource isolation between things that produce data and things that consume data. Kafka is often used as a central repository of streams, where events are stored in Kafka for an intermediate period of time before they are routed elsewhere in a data cluster for further processing and analysis.
Druid
Druid is a streaming analytics data store that is ideal for powering user-facing data applications. Druid is often used to explore events immediately after they occur and to combine real-time results with historical events. Druid can ingest data at a rate of millions of events per second and is often paired with a message bus such as Kafka for high availability and flexibility.
Apache Kafka and Druid, BFFs
In our described stack, Kafka provides high throughput event delivery, and Druid consumes streaming data from Kafka to enable analytical queries. Events are first loaded in Kafka, where they are buffered in Kafka brokers before they are consumed by Druid real-time workers. By buffering events in Kafka, Druid can replay events if the ingestion pipeline ever fails in some way, and these events in Kafka can also be delivered to other systems beyond just Druid. When used together, they can help build streaming analytics apps.
In our tutorial, we are going to set up both Kafka and Druid, load some data, and visualize the data.
Getting started with Apache Kafka and Druid
Prerequisites
You will need:
* Java 7 or better
* Node.js 4.x (to visualize the data)
* Linux, Mac OS X, or other Unix-like OS (Windows is not supported)
On Mac OS X, you can use Oracle’s JDK 8 to install Java and Homebrew to install Node.js.
On Linux, your OS package manager should be able to help for both Java and Node.js. If your Ubuntu-based OS does not have a recent enough version of Java, WebUpd8 offers packages for those OSes. If your Debian, Ubuntu, or Enterprise Linux OS does not have a recent enough version of Node.js, NodeSource offers packages for those OSes.
We will load the Wikipedia edits data stream for our tutorial. We will be using Imply’s distribution of Druid 0.9.0 and Confluent’s distribution of Kafka 0.10.0.
We’ll also need to download a small program that pulls events from Wikipedia and loads them into Kafka.
Starting Druid
First, in your favorite terminal, download and unpack the Druid distribution.
curl -O http://static.imply.io/release/imply-1.2.1.tar.gz
tar -xzf imply-1.2.1.tar.gz
At this time, let’s also download our helper program that will load edits from Wikipedia directly into Kafka.
curl -O http://static.imply.io/quickstart/kafka-wikiticker.tar.gz
tar -xzf kafka-wikiticker.tar.gz
Next, you’ll need to start up Imply, which includes Druid, Pivot, and ZooKeeper. You can use the included supervise program to start everything:
cd imply-1.2.1
bin/supervise -c ../kafka-wikiticker/conf/quickstart.conf
Starting Kafka
In a separate terminal, download and unpack the release archive.
curl -O http://packages.confluent.io/archive/3.0/confluent-3.0.0-2.11.tar.gz
tar -xzf confluent-3.0.0-2.11.tar.gz
cd confluent-3.0.0
Start a Kafka broker by running the following command in the new terminal:
./bin/kafka-server-start ./etc/kafka/server.properties
That’s it! Your Wikipedia data should now be in Kafka, and this data should be flowing from Kafka to Druid. Let’s visualize this data now.
Visualizing your data
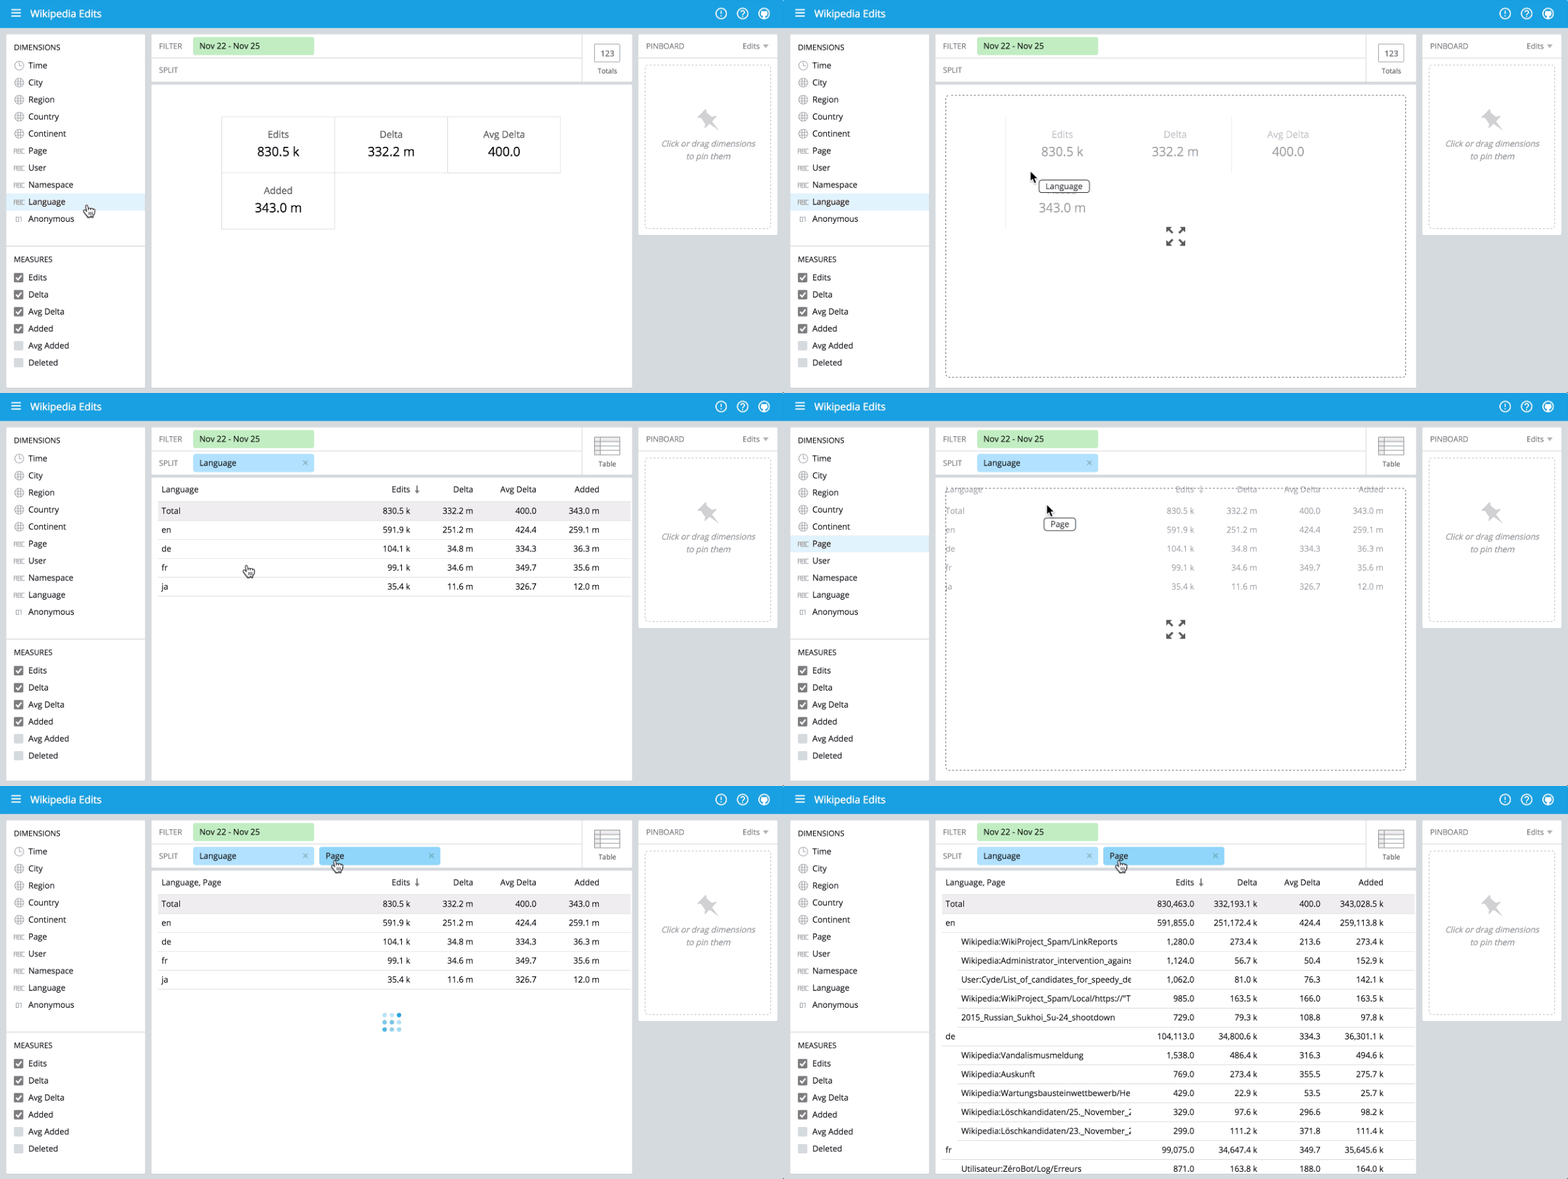
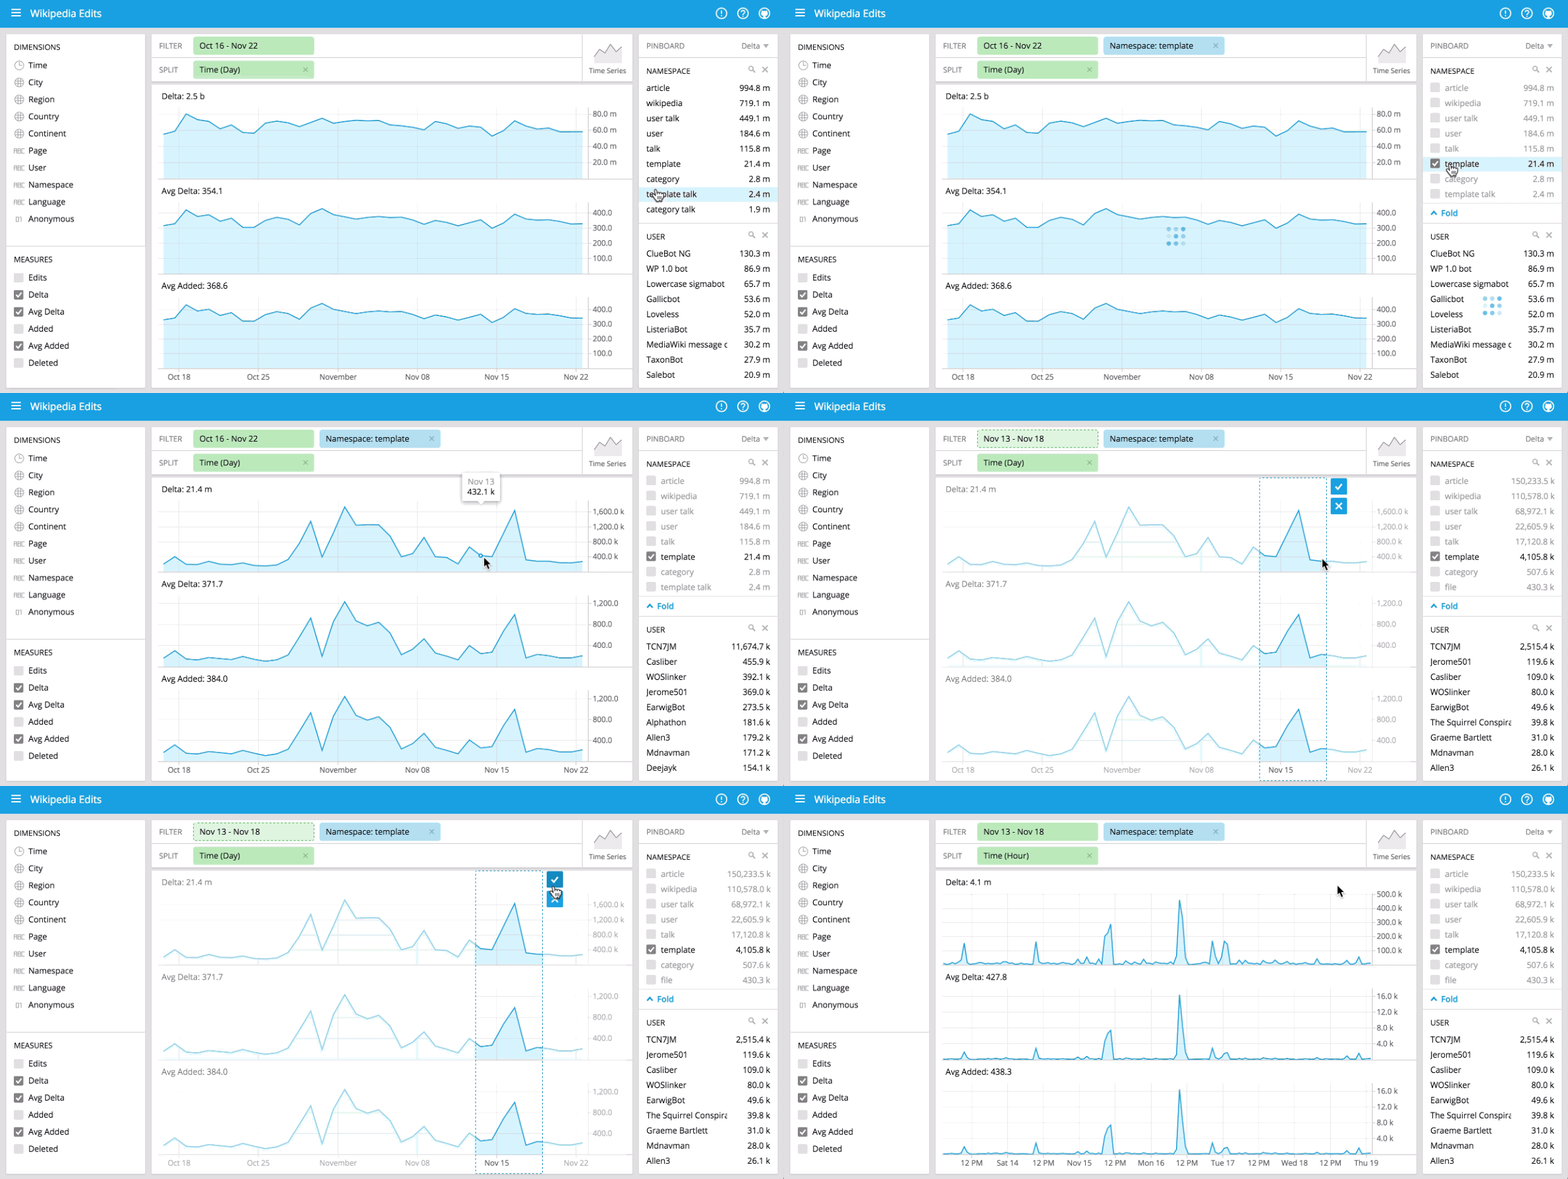
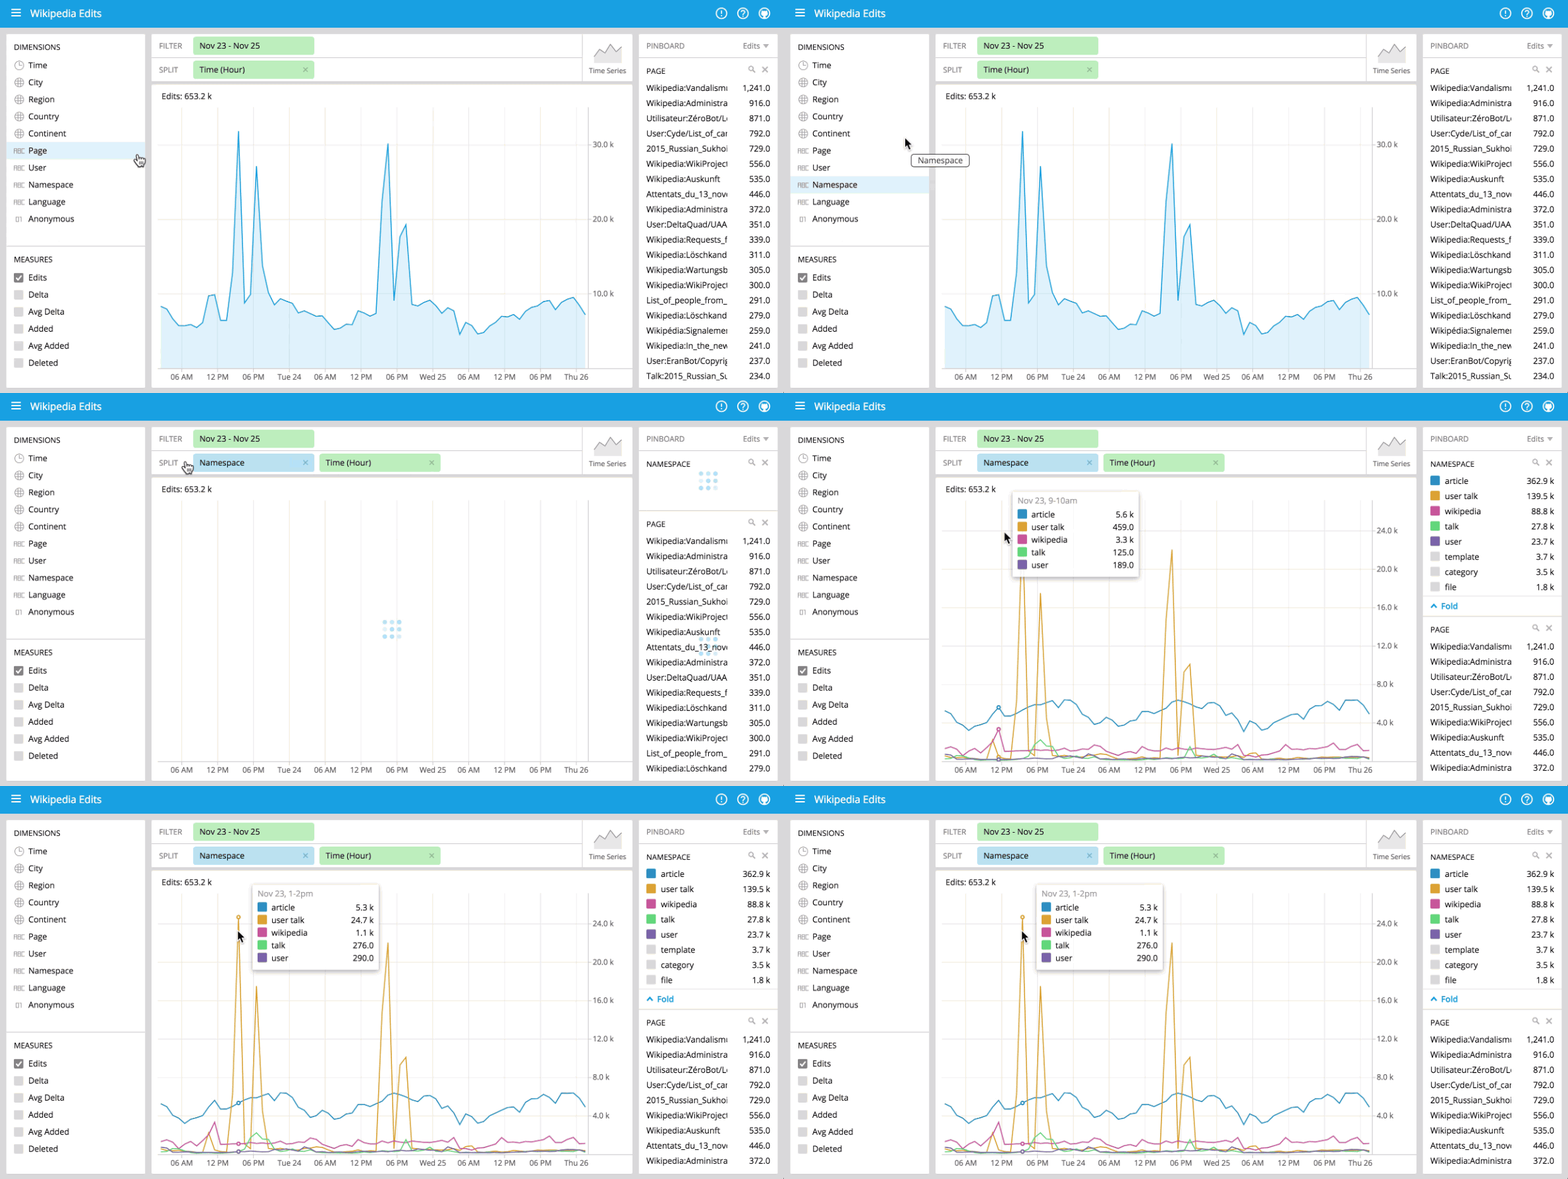
You can immediately begin visualizing data with our stack using Pivot at http://localhost:9095/pivot. Pivot is an open source data visualization application centered around two primary operations: filter and split. Filter is equivalent to WHERE in SQL, and split is equivalent to GROUPBY. You can drag and drop dimensions into Pivot and examine your data through a variety of different visualizations. Some examples of using Pivot are shown below:
 Drag-and-drop UI
 Contextual exploration
 Comparisons
Please note that if you split on time, you may only see a single data point as only very recent events have been loaded.
Further reading
Kafka and Druid can be used to build powerful streaming analytic apps. If you want to learn more about how to load your own datasets into Kafka, there is plenty of information in the Confluent docs. For more information about loading your own data into Druid and about how to set up a highly available, scalable Druid cluster, check out Imply’s documentation.
This is a guest blog from Fangjin Yang. Fangjin is the co-founder and CEO of Imply, a San Francisco based technology company.
Did you like this blog post? Share it now
Subscribe to the Confluent blog
Introducing KIP-848: The Next Generation of the Consumer Rebalance Protocol
Big news! KIP-848, the next-gen Consumer Rebalance Protocol, is now available in Confluent Cloud! This is a major upgrade for your Kafka clusters, offering faster rebalances and improved stability. Our new blog post dives deep into how KIP-848 functions, making it easy to understand the benefits.
How to Query Apache Kafka® Topics With Natural Language
The users who need access to data stored in Apache Kafka® topics aren’t always experts in technologies like Apache Flink® SQL. This blog shows how users can use natural language processing to have their plain-language questions translated into Flink queries with Confluent Cloud.
