Monitoring Confluent Platform with Datadog
Earning customer love is a core value at Confluent, and like all relationships, listening makes the love flourish. When it comes to monitoring, we’ve heard you, and we are pleased to announce a new agent-based integration with Datadog for monitoring Confluent Platform. With this new integration, our mutual customers will be able to monitor Confluent Platform alongside the rest of their IT infrastructure components and leverage the flexible capabilities of Datadog’s monitoring solution.
Confluent Control Center continues to be a great option for the fully integrated view of Confluent Platform when you are looking to monitor and manage in a single UI experience. It provides a highly opinionated view of metrics for helping make administrative decisions, and we will continue our investment in this area. However, we also know that our customers need to have an integrated monitoring view across their entire IT stack to feel confident in production, so we’re partnering with Datadog to make that as easy as possible.
How it works
Datadog has had an Apache Kafka® integration for monitoring self-managed broker installations (and associated Apache ZooKeeper™ deployments) with their Datadog Agent for several years. The Confluent Platform integration adds several new capabilities:
- Monitoring for Kafka Connect, ksqlDB, Confluent Schema Registry, and Confluent REST Proxy
- Monitoring for Java-based Kafka clients
- Default Confluent Platform dashboard with the most critical metrics
- Optionally configured log collection
This integration comes pre-installed starting in Agent v6.19 and v7.19. Users unable to upgrade Agent versions can install the integration on the Agent with a simple command:
sudo -u dd-agent datadog-agent integration install datadog-confluent_platform==1.0.0
Once this integration is installed, start pulling in the JMX metrics from Confluent Platform services by going to the confluent_platform.d directory in the Agent’s conf.d directory, and take a look at the conf.yaml.example file located there. Then modify the instances stanza to add all of the hosts you want to monitor. Restart the Agent, and you will start to see metrics emitted to Datadog for all of the Confluent Platform services that you have configured. The Agent will also start collecting host-level system metrics related to CPU, memory, disk I/O, and network I/O. For more details, see the documentation.
Here’s an example of what the default dashboard that comes with the integration looks like once you have configured the Agent:
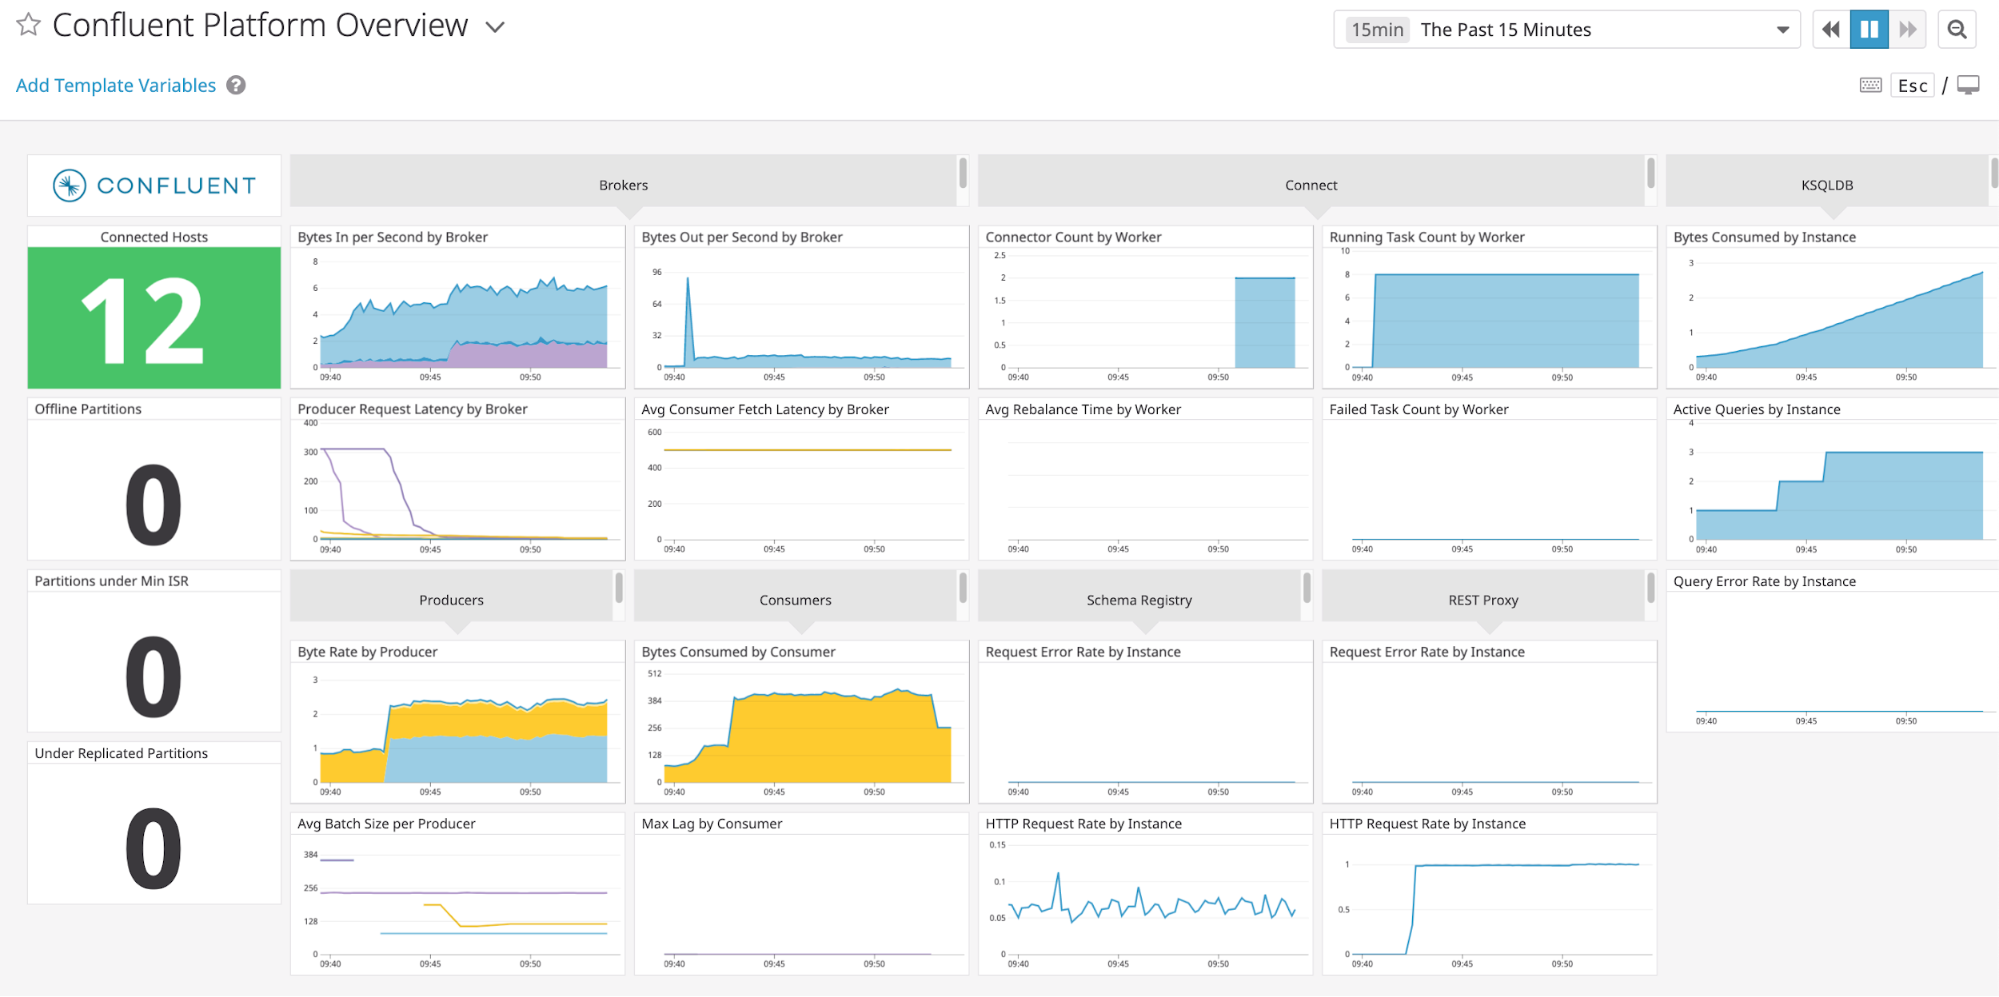
This dashboard gives you a starting point for showcasing the different components. We recommend that you copy this dashboard and then start slicing and dicing the data as you need to for your business.
Control Center 🤝 Datadog: Better together
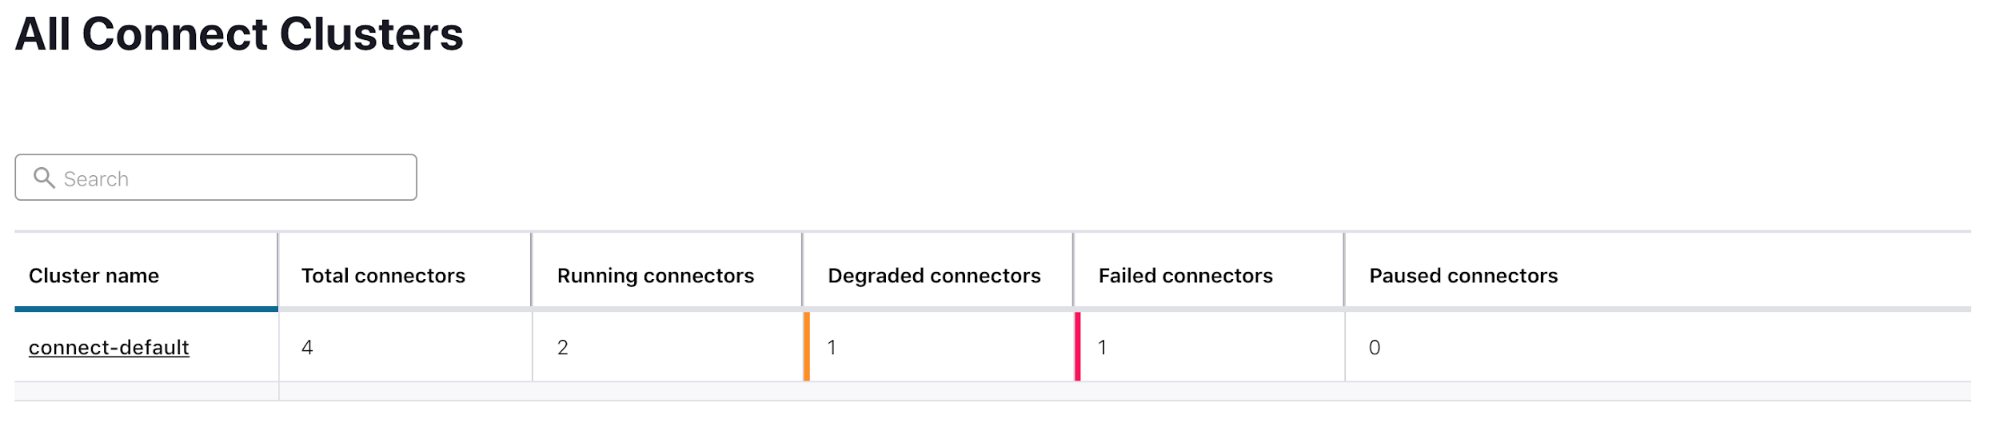
If you use Datadog as your central monitoring tool, there is complementary value in utilizing Control Center’s management capabilities. Take a look at the Failed Task Count by Worker graph in the dashboard above. How do you know which steps to take next? By using Control Center’s capabilities to drill into Connect issues and fix them in the same UI, you can first see at a high level how many connectors are impacted by the failed tasks:
Then you can get further details on the tasks from the degraded connector to get an idea of which hosts are impacted so you can determine if the problem is with the connector or with a particular set of tasks. In this case, you can see that the connector as a whole has failed, so you know the problem is likely with the configuration of the connector or with a downstream system. You can start debugging the connector configuration directly in the Control Center UI.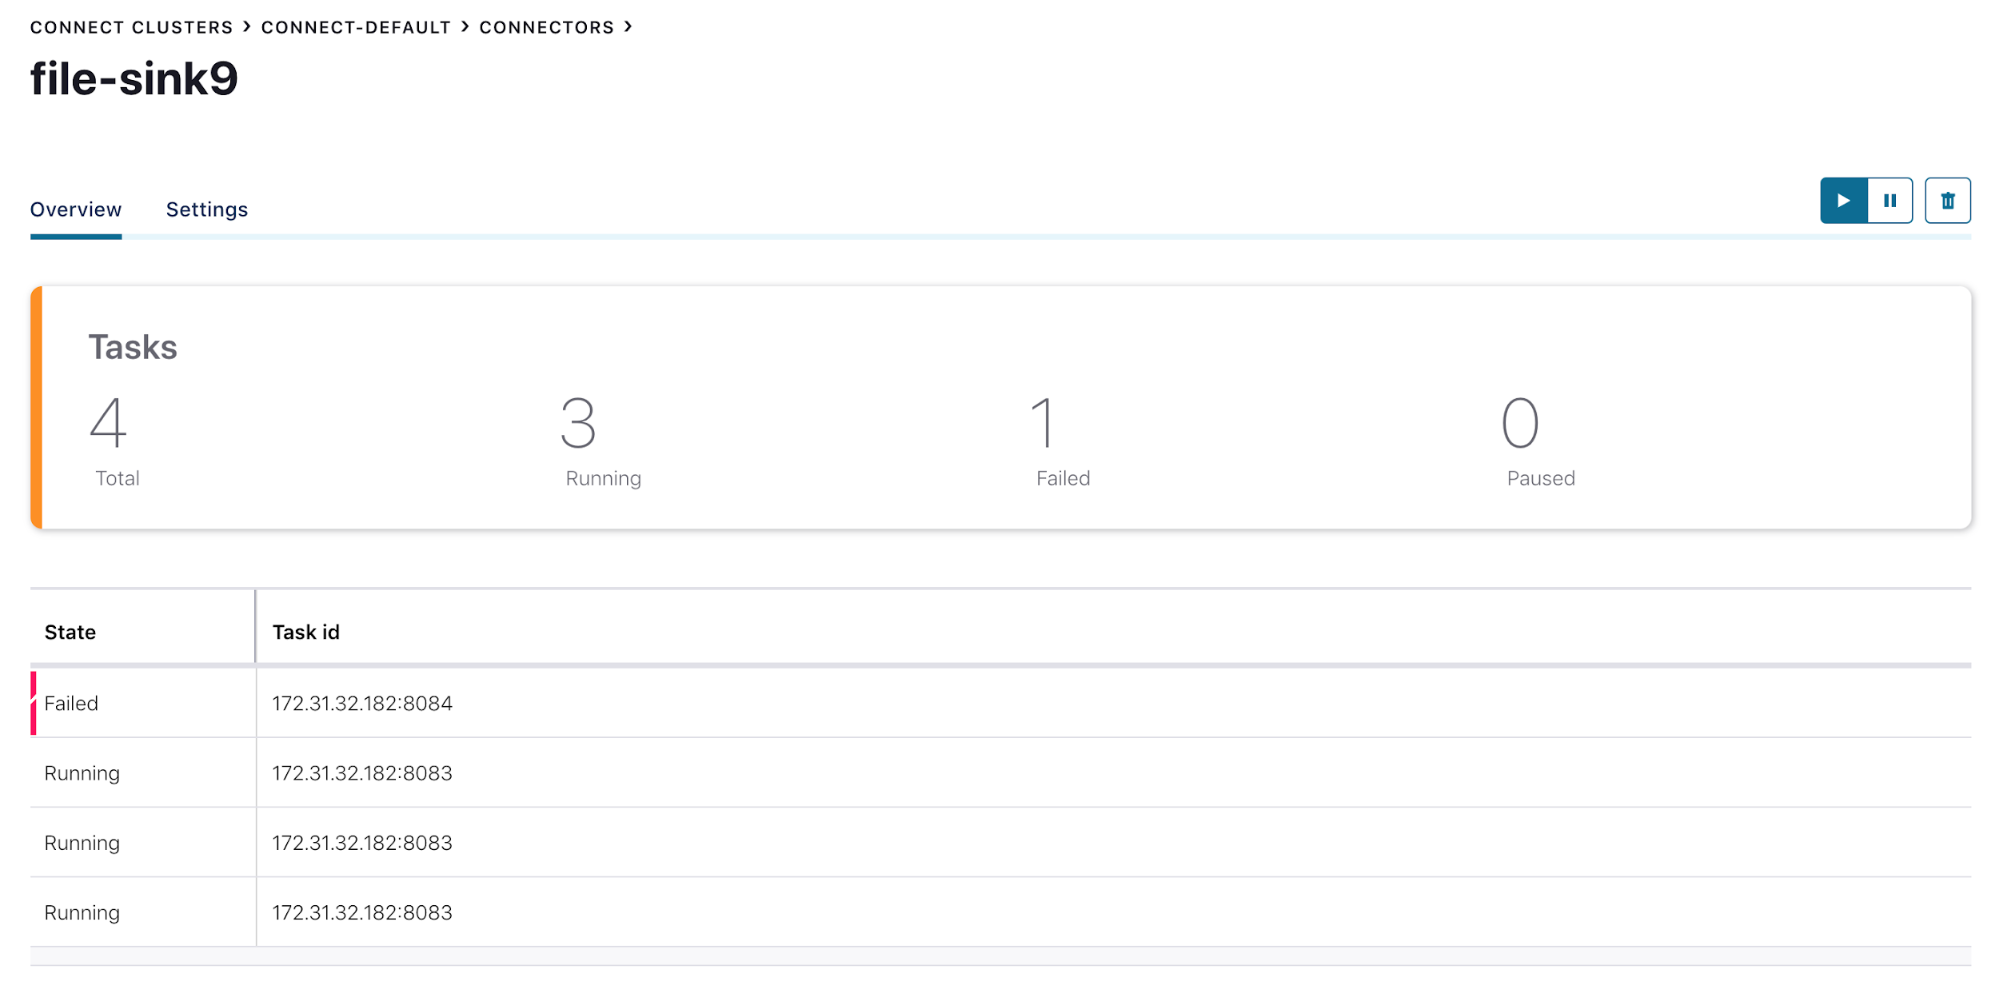
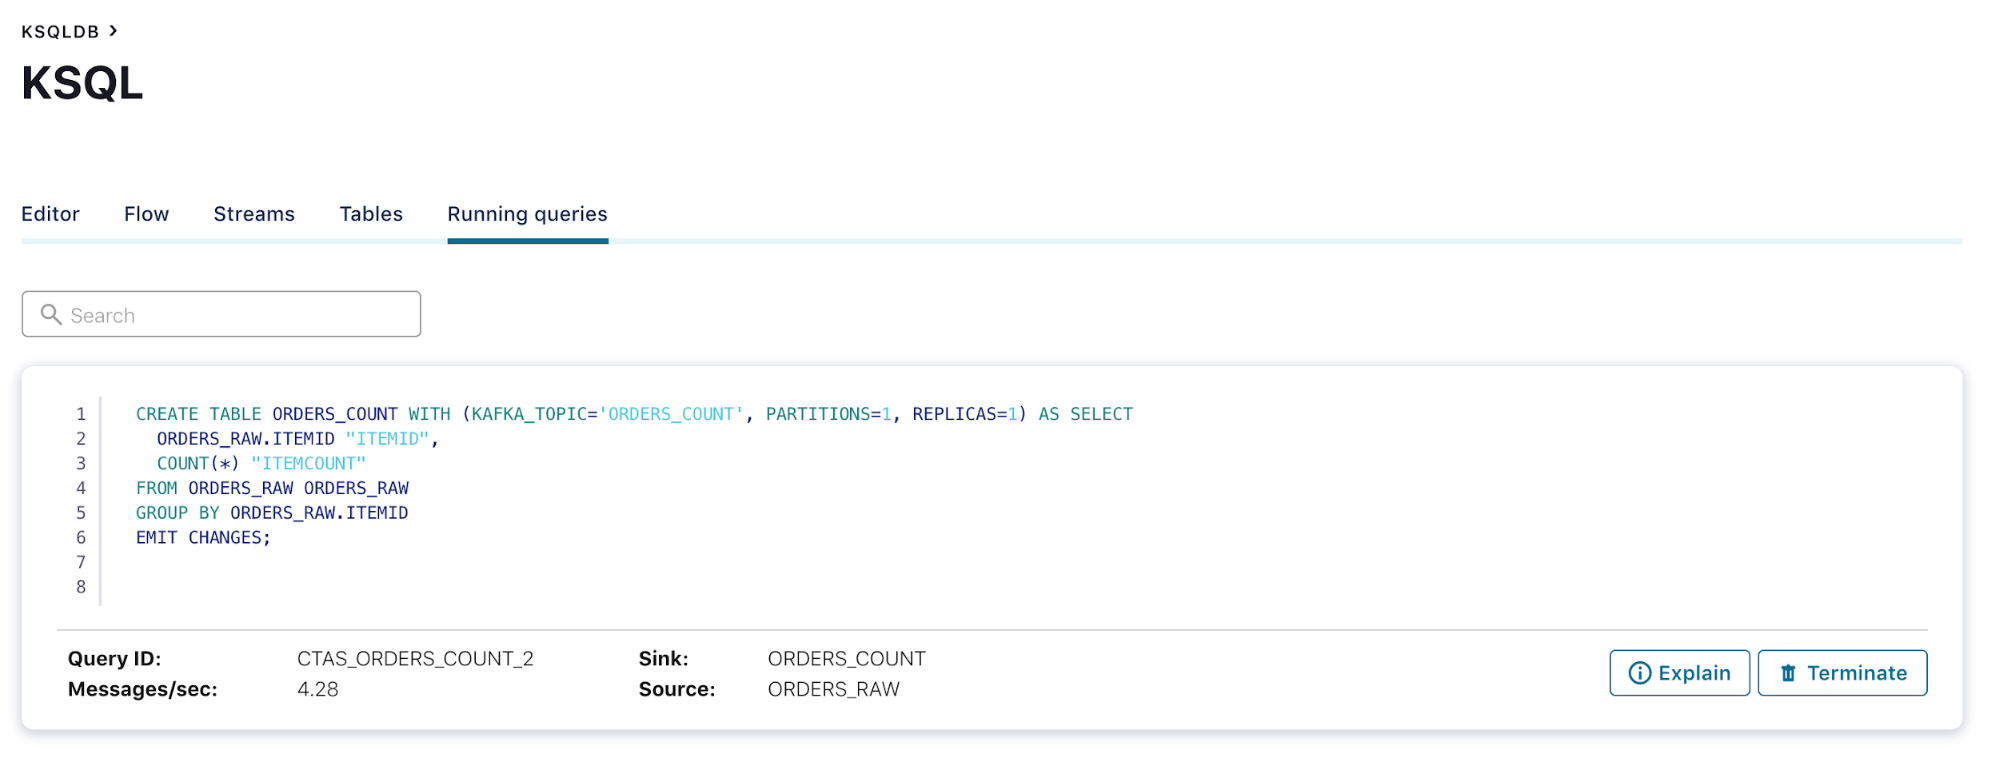
You can take a similar approach when you see anomalies in the number of ksqlDB queries running. Most clusters will experience a steady rate of querying, but what if you start to see a spike in running queries in the Datadog dashboard? You can use Control Center to take a look at what queries are running to find out if there is a new, unexpected use case that is driving the load.
If you are using Datadog today, go try the integration! We’re excited to expand our integrations with popular monitoring tools to help our customers get the maximum value across their organization from Confluent Platform. If you have a monitoring tool that you’d like to see integrated in a more seamless way, please send us your feedback in #observability on the Community Slack!
このブログ記事は気に入りましたか?今すぐ共有
Confluent ブログの登録


Customer Intelligence Hub: A Single Pane of Glass for Customer Insight and Action
Customer Intelligence Hub unifies customer signals into a real-time, AI-powered view that helps GTM teams prioritize risk, identify opportunity, and act faster with contextual insights.