[Webinar] How to Implement Data Contracts: A Shift Left to First-Class Data Products | Register Now
Real-Time Log Analytics as a Service with Confluent and Elasticsearch
Collecting and indexing logs from servers, applications, and devices enables crucial visibility into running systems. A log analytics pipeline allows teams to debug and troubleshoot issues, track historical trends, or investigate security incidents. The most commonly deployed log analytics combines Apache Kafka® and Elasticsearch to create a reliable, scalable, and performant system to ingest and query data. The time it takes to deploy a new log pipeline is a key factor in if a new data project will be successful. Kubernetes and disaggregated storage simplify Kafka and Elasticsearch clusters and are essential for scaling and operating log pipelines in production.
Kubernetes makes deploying log pipelines as a service easy, with CSI dynamic volume provisioning allowing for easy scaling and adjusting of resources. More importantly, recently released features for both applications, Confluent Tiered Storage and Elastic Searchable Snapshots, use object store to fully disaggregate compute and storage in log analytics.
A cloud-native disaggregated pipeline architecture with fast object storage means:
- More efficient resource usage by avoiding deploying extra nodes just to increase storage and no longer needing full replicas for data protection.
- Faster failure handling by making pods (brokers or data nodes) near-stateless. With small, bounded amounts of storage attached to a pod, rebalance operations are orders of magnitude faster.
- Support for fast historical searches with the predictable all-flash performance of FlashBlade.
This blog post describes a helm meta-chart that demonstrates how to automatically deploy a full pipeline that automates the deployment and configuration of a disaggregated log analytics pipeline based on Kafka and Elasticsearch. The diagram below illustrates the deployed pipeline architecture:
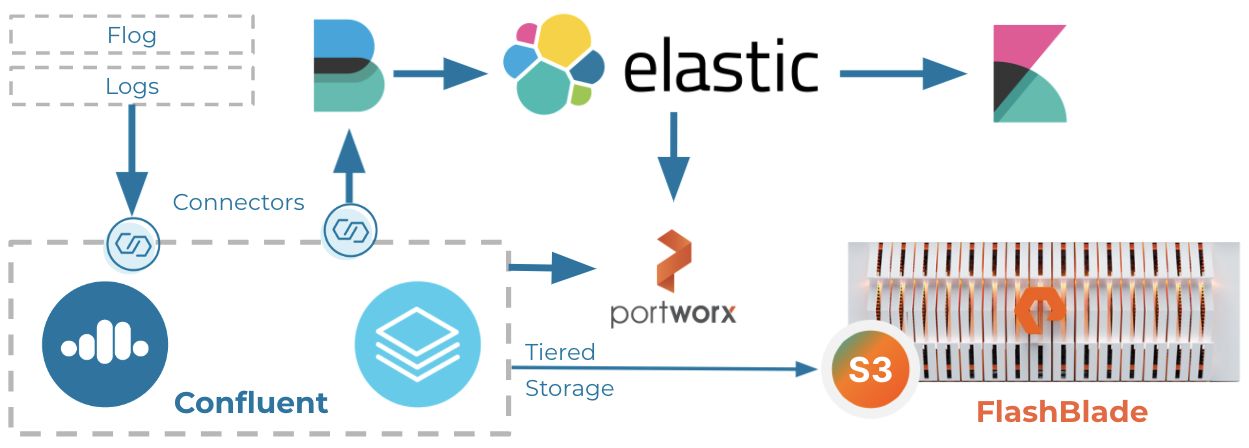
Confluent and Elasticsearch PersistentVolumes orchestrated by Portworx while also using S3 buckets for long-term shared storage. The PortWorx storage can be backed by local drives, FlashArray volumes, or FlashBlade NFS.
Why would you want to do this?
- Log analytics as a service, so each team and project can create and operate independently with just the resources they need. The alternative is custom infrastructure silos for each team, all configured and managed slightly differently.
- Easily scale up or down cluster resources (compute or storage) as needed and in a self-service manner.
- Modify resource requirements without changing hardware, e.g., more compute for one cluster and less storage for another.
- Run multiple heterogeneous clusters on a shared hardware pool.
The alternative to the cloud-native disaggregated architecture is a group of infrastructure silos, one for each application component. These silos present challenges as each needs a customized hardware profile (cores, storage), which drifts and changes over time. With Kubernetes and FlashBlade, we instead optimize for the time it takes to deploy your team’s next production data pipeline.
How shared storage simplifies aaS log pipelines
Shared storage powers as a service log pipelines in two key forms: object storage and remote PersistentVolumes. Object storage requires application awareness to fully take advantage of a scalable, reliable, and performant object store like FlashBlade. In contrast, PersistentVolumes provide many of the benefits without requiring changes to the application; a remote PersistentVolume transparently replaces a local drive.
You can also find a video demo illustrating how object storage simplifies operations of this log analytics pipeline as well as previous blogs on Simplifying Kafka with Confluent Tiered Storage and Elasticsearch Snapshots.
Object storage
The ease of use, scalability, and prevalence of S3 object storage has resulted in a generation of applications re-architecting themselves from a converged model with direct-attached storage to a disaggregated model with shared storage. Object stores like AWS or FlashBlade scale performance and capacity linearly, moving storage management tasks out of the application so that additional nodes are not needed just to add and manage storage.
With disaggregated object storage, adding or removing a node to either the Kafka or Elasticsearch cluster does not require rebalancing of the data on the remote object store. Instead, only logical pointers are updated. Further, software upgrades are simpler because if an application upgrade goes awry, the data is still safely stored on the object store.
A key outcome of disaggregating the storage for Confluent and Elastic with objects is that you can now bound the amount of data local to a node, thereby bounding the amount of data to be rebalanced on a node failure. For example, if all nodes have at most 500 GB of data on their PersistentVolume, then the rebalance time is the same whether your total dataset is 1 TB or 100 TB. As clusters grow, keeping rebalance times manageable is crucial to operational simplicity and reliable service.
This log analytics pipeline uses object storage for three different purposes:
- Confluent Tiered Storage
- Elastic Frozen Tier backed by Searchable Snapshots
- Elasticsearch Snapshot Repository for data protection
One of the customized elements of the helm chart is a script that automates bucket creation and authentication on the object store. These are tasks that should be greatly simplified in the future as the Container Object Storage Interface comes to maturity. Finally, object store is also used for backing up Elasticsearch indices in case of accidental corruptions.
PersistentVolume dynamic provisioning
A second way that shared storage simplifies running log analytics pipelines is through dynamic provisioning of Persistent Volumes using a Container Storage Interface (CSI) plugin. In this pipeline, both Kafka and Elasticsearch use statefulsets that automate the creation and attachment to volumes using PortWorx.
The advantages of a remote PersistentVolume when compared to local storage are:
- Provisioning of storage is decoupled from CPU and RAM, meaning that Kubernetes can schedule pods only considering CPU and RAM without introducing an additional constraint.
- Pod and node failure recovery is orders of magnitude faster because Kubernetes will restart a failed pod on a different node while reattaching to the same remote volume, thus avoiding expensive rebalances.
- Volumes can be dynamically grown as needed without the restrictions of physical drives and drive bays.
The rest of this post describes a helm meta-chart that automatically installs and configures a disaggregated log analytics pipeline in Kubernetes. This helm chart is not intended for production use as is, but rather as a building block to help understand the advantages of disaggregated log pipelines and to jump-start the deployment of new production pipelines.
Log pipeline components
This section describes the end-to-end components of our log analytics pipeline as installed by the helm chart example. Most of the chart deploys templated YAML and is a straightforward exercise in Kubernetes deployments, but there are a few additional setup steps for configuring the FlashBlade and the Elasticsearch policies.
Prerequisites
The following assumptions are made by the Helm chart:
- CSI Driver or PortWorx installed on Kubernetes
- Confluent for Kubernetes (CFG) v2 installed
- Elastic Cloud for Kubernetes (ECK) v1.5+ installed
- Configured Elastic license (trial or enterprise license)
- Helm v3 present
FlashBlade configuration
The log pipeline requires several buckets for object storage, so this helm chart first creates the necessary S3 accounts, users, keys, and buckets on the target FlashBlade using a separate python script named s3manage. As a pre-install hook, this script enables the creation of the necessary account and bucket before the rest of the software starts up. Access and secret keys for bucket access are stored as a Kubernetes secret that is later used to populate environment variables.
This configuration via custom scripting is exactly the problem that the upcoming Container Object Storage Interface (COSI) standard addresses: a portable way of creating buckets and provisioning access to those buckets. My script automates provisioning on the FlashBlade, but we need to wait for COSI to create a portable approach that uses native Kubernetes concepts and that would also work with other object store backends.
Flog: Synthetic log generator
A synthetic load generator is included to demonstrate how data flows through the log pipeline. Flog is a fake log generator with Apache weblog-like output which can generate an infinite stream of pseudo-realistic data. To see an example of the output generated by flog, use the following docker run command:
> docker run -it --rm mingrammer/flog
…
137.97.114.3 — — [27/Aug/2020:19:50:11 +0000] “HEAD /brand HTTP/1.1” 416 16820
252.219.8.157 — — [27/Aug/2020:19:50:11 +0000] “PUT /maximize/synergize HTTP/1.0” 501 4208
…
Confluent
The helm chart uses the Confluent for Kubernetes operator (v2) to provision a Kafka resource with an S3 Tiered Storage backend. Kafka is a reliable message queue that holds incoming log data before being processed and ingested by downstream systems. In most log pipelines, a message queue like Kafka buffers incoming data before ingestion by downstream systems like Elasticsearch. The result is that downtime or performance regressions in Elasticsearch do not result in dropped data. It also enables separate real-time applications to watch the same data stream.
Confluent provides support and premium features on top of Kafka, including Tiered Storage which utilizes an object store backend to more efficiently store topic data and keep the brokers lightweight. By making the Kafka brokers near-stateless, operations like scaling up or down clusters and handling broker failures no longer need expensive rebalance operations. As an example, recovering from a broker failure with Tiered Storage takes seconds in comparison to hours or days without.
Tiered Storage is a natural fit for Kubernetes because it limits the amount of state managed by the pods, making it easier to provision pods, migrate them, and scale the pod count up or down.
FileBeats
The next step in a log analytics pipeline is to ingest data from Kafka into Elasticsearch for indexing and ad hoc querying. There are many ways to glue these two services together, including Apache Spark or Kafka Connect Elasticsearch Sink. For basic ease of configuration, we will use Filebeats to pull data from Kafka to Elasticsearch.
Elasticsearch
Elasticsearch is a flexible and powerful unstructured database for high-performance ad hoc queries on log data. Just like with Confluent Tiered Storage, Elastic has recently released a Frozen Tier backed by Searchable Snapshots as a way to offload the bulk of indexed data to an object store. Disaggregating the hot tier indexing from the bulk storage enables an Elasticsearch cluster to scale resource usage independently as well as simplifying failure scenarios by making data nodes lightweight and faster to rebalance.
This helm chart configures Elasticsearch to leverage a Frozen Tier for the bulk of its storage needs as well as a separate snapshot repository to protect index data from accidental corruptions. These Index Lifecycle Management (ILM) and Snapshot Lifecycle Management (SLM) policies are configured in the helm chart via a post-install hook.
Example values.yaml file
The following is an example values.yaml file that deploys a log pipeline using PortWorx for NVME PersistentVolumes for both Kafka and Elasticsearch. The FlashBlade S3 credentials and buckets are automatically created by using the FlashBlade API token.
Flashblade:
datavip: "10.62.64.200" mgmtvip: "10.62.64.20" token: "T-XXXXXX-YYYYY-ZZZZ-QQQQQ-813e5a9c1222" zookeeper: storageclass: "px-nvme" kafka: cpVersion: 6.2.0 storageclass: "px-nvme" nodecount: 4 elasticsearch: nodecount: 6 version: 7.15.0 storageclass: "px-nvme" beats: nodecount: 12 flog: nodecount: 1
How to adapt for your use case
The helm chart configures a log pipeline with synthetic log data. To adapt for real data sources, you need to make a few key changes and then optionally tweak some parameters:
- Disable the flog generators and replace with real data sources sent to a topic in Kafka
- Edit the filebeats configmap and change the “topics” setting to reflect your real topic(s)
- Edit the node counts in values.yaml to achieve the needed indexing performance
- Modify the snapshot policy (SLM) in post-install-es-snaps.yaml to meet your protection/recovery requirements
You could fork the helm chart or render it locally and then make the necessary changes to build towards a production use case.
Storage usage visualized
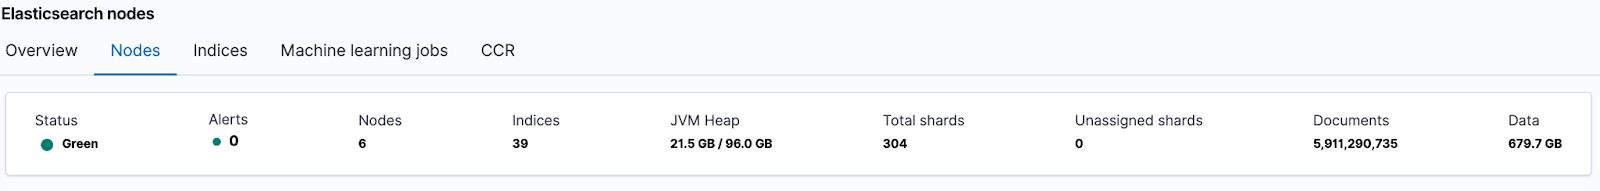
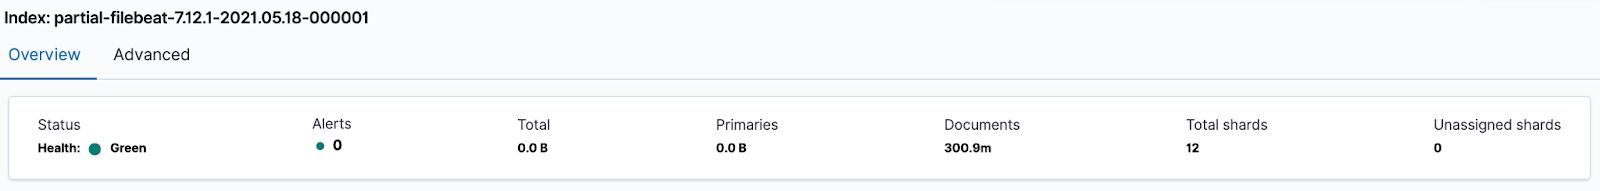
After running the log pipeline for over a day, the Kibana monitoring dashboard shows the impact of disaggregation in the pipeline. In the cluster summary below, there are approximately six billion documents indexed and 700 GB of total data. But this count of data only includes the local storage across data nodes, not the data on the Frozen Tier.
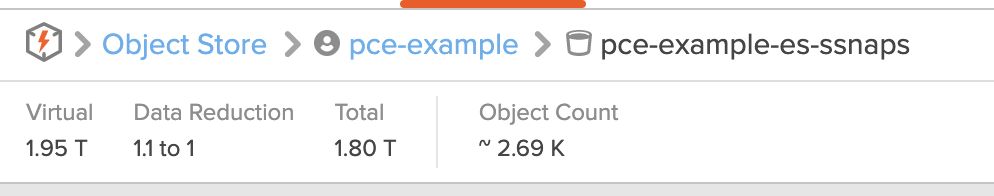
Looking at the FlashBlade bucket configured for the Frozen Tier, we see that there is an additional 1.95 TB of data stored here. There is a further 10% in space savings due to the FlashBlade’s inline compression.
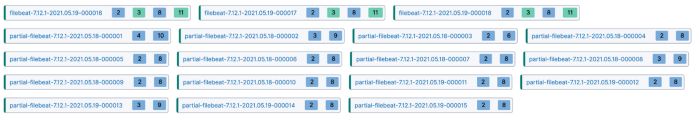
An examination of the indices shows that filebeat rolls after reaching 50 GB in size. Due to the Frozen Tier, there are two other things to notice. First, indexes are renamed to add the “partial-” prefix once they are moved to the Frozen Tier and second, replica shards are not stored on the Frozen Tier. This enables more efficient space usage; instead of relying on storing multiple full copies, the FlashBlade internally uses parity coding to protect against data loss with less overhead.
Looking more closely at an index on the Frozen Tier shows zero space usage. This means that the index takes up no space on a data node’s PersistentVolume and is instead entirely resident on the S3 snapshot repository.
Shifting to the FlashBlade performance graphs, you can see the data node local IO (top) which corresponds to the indexing activity on PersistentVolumes. The second graph shows the associated S3 write traffic as indices are finished and migrated to the Frozen Tier.
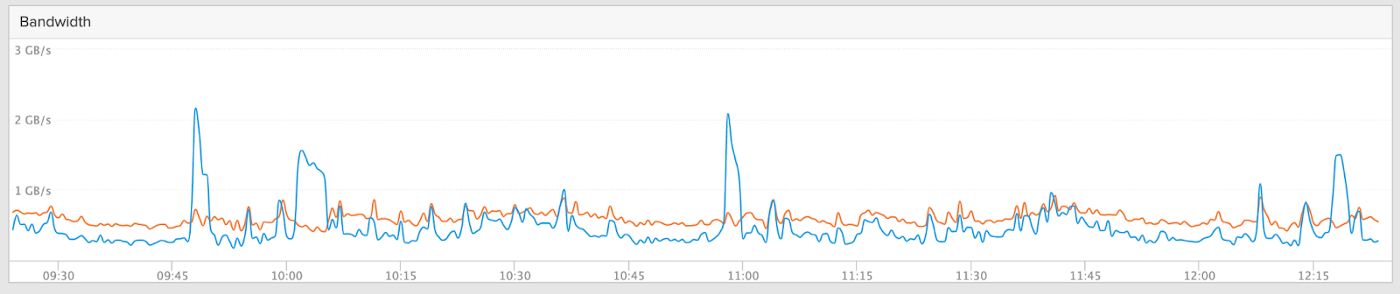
Write (orange) and Read (blue) performance for Elasticsearch ingest
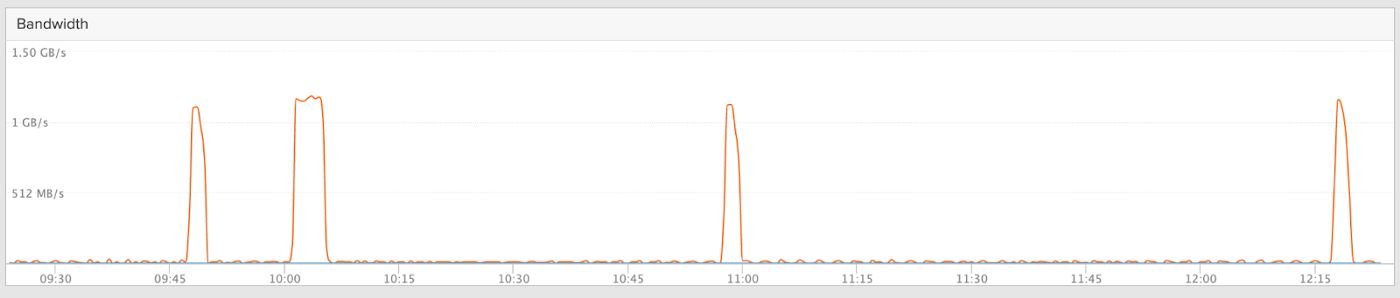
Write spikes to S3 as indices are moved to the Frozen Tier
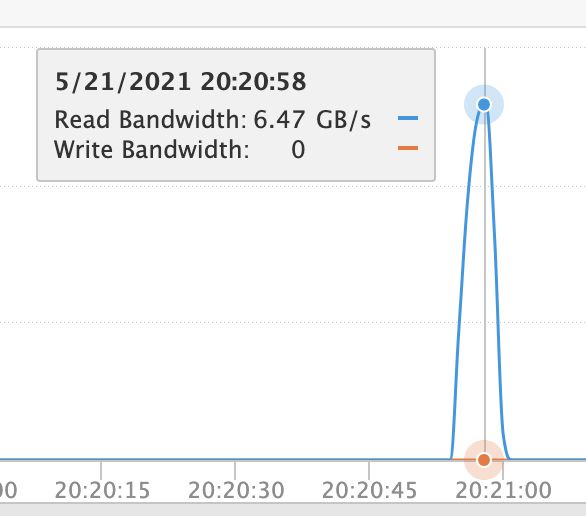
Queries against the Frozen Tier take advantage of the FlashBlade’s all-flash performance. Querying historical data now benefits from linearly scaling performance along with the simplicity and efficiency of FlashBlade. In the screenshot below, the FlashBlade shows up to 6.5 GB/s reads from the S3 bucket during a simple match query. The result is that 4.8 TB of index data can be searched in six seconds!
And finally, by looking at the storage usage in the Confluent Control Center, you can see a similar breakdown of data local to the brokers and data stored on the object store. So while 1.3 TB of data is currently in the Kafka instance, you would only need to rebalance up to 230 MB of data to handle node failures or cluster scaling.

Conclusion
Log analytics pipelines with Confluent and Elastic ensure the ingestion and searchability of a wide variety of log data and enable use cases like fraud detection, performance troubleshooting, and threat hunting. Creating these pipelines on-demand for different teams and projects requires an as-a-service platform like Kubernetes and disaggregated storage.
Object storage and dynamic PersistentVolumes simplify the provisioning and operation of these pipelines. PortWorx and FlashBlade make it easy to provide Kubernetes-native storage for both Kafka and Elasticsearch, allowing you to quickly scale clusters up or down as well as growing volumes as needed. FlashBlade provides an object storage backend for Confluent Tiered Storage and Elastic’s Frozen Tier with Searchable Snapshots. Using FlashBlade object storage limits the overhead and complexity of rebalancing across nodes when clusters scale or experience node failures.
If you’d like to get started with a fully managed service for Apache Kafka, get started with a free trial of Confluent Cloud and use the code CL60BLOG for an additional $60 of free usage.*
Did you like this blog post? Share it now
Subscribe to the Confluent blog


Confluent and Amazon EventBridge for Broad Event Distribution
Learn how to stream real-time data from Confluent to AWS EventBridge. Set up the connector, explore use cases, and build scalable event-driven apps.


New With Confluent Platform 8.0: Stream Securely, Monitor Easily, and Scale Endlessly
This blog announces the general availability (GA) of Confluent Platform 8.0 and its latest key features: Client-side field level encryption (GA), ZooKeeper-free Kafka, management for Flink with Control Center, and more.