[Virtual Event] Agentic AI Streamposium: Learn to Build Real-Time AI Agents & Apps | Register
Lessons Learned from Evolving a Risk Management Platform to Event Streaming
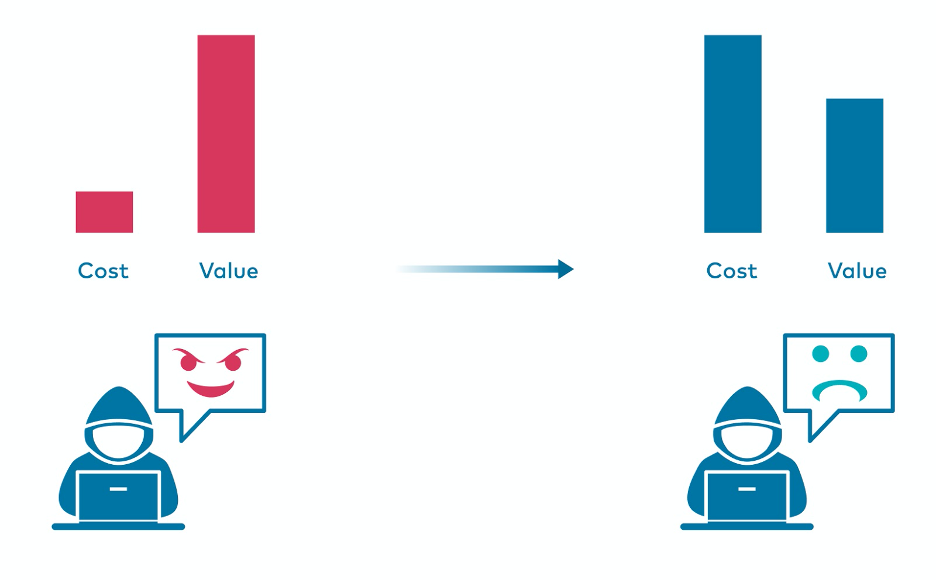
Every organization that exposes its services online is subject to the interest of malicious actors. The ongoing struggle with botnets, crawlers, script kiddies, and bounty hunters is challenging and requires the constant evolution of security platforms. Attackers approach certain systems with different motivations, which drives the need for organisations to perform analysis of incoming traffic from multiple perspectives. With just basic security mechanisms in place, oftentimes the cost of performing a successful attack is minimal compared to the value gained by the bad actor. This is why organisations invest a lot of time and money to address this situation to discourage attackers and make them go away.
 Attack profitability
Risk management is the collective responsibility of multiple units within Tesco PLC, and Identity provides authentication mechanisms for different types of users. One of the security measures present in the Identity API is an in-house built component called Risk Engine. It has two main responsibilities:
- Perform analysis based on available data streams, that combined together form risk factors
- Trigger targeted actions and decisions to prevent different types of attacks
Risk Engine serves one of the essential requirements of the platform—it reduces account takeovers and strengthens security in order to keep customer data safe.
The beginning
The first version of the Risk Engine module was created a couple of years ago, when Identity API only supported a few clients. Its main function was to block malicious IP addresses (that exceeded defined thresholds in terms of unsuccessful authentication attempts) and lock compromised user accounts. It was based on top of JMS, which was the standard at the time for messaging. At the time it was believed that all the design decisions were optimal, however, the common truth is that the only constant thing—especially in the IT industry—is change. The amount of calls that were sent towards the Identity API increased significantly over the years, as new clients, apps, and services were onboarded. Some parts of the design could not handle such high traffic volumes and it became more and more difficult to maintain the component.
 Architecture of Risk Engine v1
Several challenges impacted the success of the first version of the Risk Factor engine. First, all the calculated results—i.e., counters and statistics—were kept in memory, making the application’s state not persistent. As a result, this implied that only a single instance of the service could run and handle all the traffic. Further consequences were the lack of high availability and the inability to scale the service horizontally, as potential multiple instances had no way to synchronize and split the work between themselves. Moreover, there was data loss—whenever the running instance was terminated or restarted, all the counters were reset to zero. There were attempts to introduce parallel message processing using multiple consumer threads, but the results were not satisfactory because the codebase made use of locks and critical sections, which are well known for limiting concurrency. The last shortcoming of the solution, which was accentuated at a certain scale, was that a single incoming message could trigger up to three remote calls to the database, imposing a data fanout anti-pattern.
In general, the platform was unable to perform at scale, causing slow processing time and an ever-growing backlog of messages. As a result, Risk Engine was no longer able to catch up with real-time events in the system.
The big idea
Together with management, the team concluded that it was time to rebuild the module from scratch. Since we had just provisioned our first Apache Kafka® cluster in production using the public cloud, it was a natural choice to use Kafka and event streaming as the backbone for the new system. We decided that all topics would be structured a bit differently than in Risk Engine v1 and with finer granularity. The four topics identified include:
- Handshakes: initialization events containing client-specific information and request metadata (geolocation, device fingerprint, and network context)
- Identifications: statements of whether the username provided was found in credentials database
- Verification: statements of whether single verification attempts succeeded (i.e., password input matched, without storing raw input)
- Session results: terminate event of a session, concluding whether it succeeded or was blocked for some reason
Even though Kafka Streams was still quite a new project (version 0.11) at the time, it was selected as the tool to build stream processing applications. The biggest benefit was the fact that it did not require to run or maintain any specific processing cluster. Over time and with the development of new features, we decided to use ksqlDB for some of the services as well—for example, to calculate the last activity date of the user’s account.
The false start
The team working on the project was new to stream processing, so we used our intuition based on experiences from previous projects with event sourcing, CQRS, and domain-driven design. As it seemed, a good starting point was to build an aggregate of the session, which would contain all the events that happened within it. The first step in the data pipeline involved a Session Aggregator, which performs the join of the required streams, which were keyed by sessionId.
{
  "sessionId": "",
  "handshake": "",
  "identifications": [{
      "result": "",
      "type": "",
      "ipAddress": "",
      "userId": ""
  }],
  "verifications": [{
      "result": "",
      "type": ""
  }],
  "result": {}
}
Session aggregate schema
The outcome of that step was emitted as an event to the Session aggregates topic and then consumed by downstream processors—Rule analyzer applications—that would extract relevant information from the aggregate, run specific checks on it, and classify the session accordingly. Architecture blueprint with Session Aggregator
Identification and verification attempts were kept in separate lists in an aggregate, and join windows were minutes or even hours in length for some of them—so it’s fairly clear that Session Aggregator was dealing with lots of state.
Additionally, as the cogroup operator was not yet available in Kafka Streams (released in version 2.5) we needed to perform chained joins. For example, to join four topics—A,B,C, and D, each having the same key, the implementation would look like the following:
- Join A and B → intermediate stream of AB
- Join AB with C → intermediate stream of ABC
- Join ABC with D → desired stream of ABCD
The above join is not optimal because it requires the creation of intermediate streams and state stores.
Shortly after deploying our stream processors to the production environment, we started to notice some problems with the chosen approach. The Session Aggregator had extremely high memory demand, causing the Kubernetes Pods to restart due to out-of-memory errors. Cache in RocksDB, which is a key-value store used by Kafka Streams, was growing larger in size, and we had a hard time limiting it. As the amount of consumed memory increased, the garbage collector kicked in quite often, also performing major collections, which also caused significant CPU spikes.
The aforementioned Kubernetes Pod restarts resulted in a frequent and long rebalancing process, during which event processing was paused (at the time, Kafka Streams didn’t support cooperative rebalancing, which is now available as of version 2.6). The fact that we were not using Persistent Volumes mounted to our Pods was only making things worse, as the whole state needed to be pulled over the network when the new Pod was spawned. In the end, we were not even able to resume processing and put our applications in RUNNING state, due to constant rebalancing.
We also observed that some partitions were processed much slower than the others, making consumer lag grow and resulting in a huge data skew. We had not checked the data distribution during the design phase. When legitimate customers attempted authentication, they sent a few requests—some succeeded, some gave up—while others went through the forgotten password journey. Attackers, on the other hand, were sending thousands of requests within a single authentication session. As the initial plan assumed gathering all session events in one aggregate event, some of these “elephant” aggregates with thousands of events reached up to 1 MB in size, which is the default message size in Kafka that shouldn’t be changed unless there is complete understanding of the consequences of such a decision.
As a remediation, there were a few actions identified and applied. As aggregates grew larger in size, we decided that there needed to be an upper limit of events that it should contain. We decided to keep the most recent 100 events for a session, but as a result, we gave up the accuracy of the processing results, which were now just approximations. Putting artificial size limits on an aggregate works fine for some use cases but not for others. A second remediation attempt was to scale the service up—both horizontally and vertically—but performance degradation and application restarts still occurred during traffic spikes. The final effort involved tuning the RocksDB configuration. With limited configuration options available at the time and our lack of experience in that area, the improvements were not satisfactory.
To learn more about RocksDB and Kafka, check out this Kafka Summit talk by Bruno Cadonna and Dhruba Borthakur on performance tuning RockDB for Kafka Streams’ state stores.
With more and more defaults and properties needing to be changed or tuned, we began to realise that there was probably something wrong with our data pipeline design. We took a step back and checked our architecture from the top level, and we noticed that the design contained a homegrown bottleneck.
 Identified bottleneck
While the Session Aggregator was distributed, it was still a potential single point of failure that all the pipelines depended on. Thus, it had the potential to stop all downstream processing. In the end, we decided that in an environment where there is live, unbounded traffic to analyze that may have significant traffic spikes, this was not the best use case to aggregate all related events as one.
Improving the design and architecture
Fortunately, we were given a chance to fix our mistakes and rebuild the platform. This time, the design started with proper data analysis, which was followed by a couple of brainstorming sessions. There were four core principles identified:
- Avoid the “one aggregate to rule them all” approach
- Focus on the main goal and requirements first; avoid implementing a sophisticated, generic approach from the start
- Keep single logical responsibility of each module
- Have multiple independent and parallel pipelines
The goal for the main feature of this solution was to block malicious IP addresses. We asked ourselves the question: What is a prerequisite for this action? The answer was to be able to classify IP as malicious after analysis of its usage statistics with defined business rules. Unwinding that process even further: What is the prerequisite for the aforementioned analysis? The answer was calculating IP usage statistics. Incoming events from certain addresses needed to be grouped and aggregated together in order to produce relevant results from specific time windows.
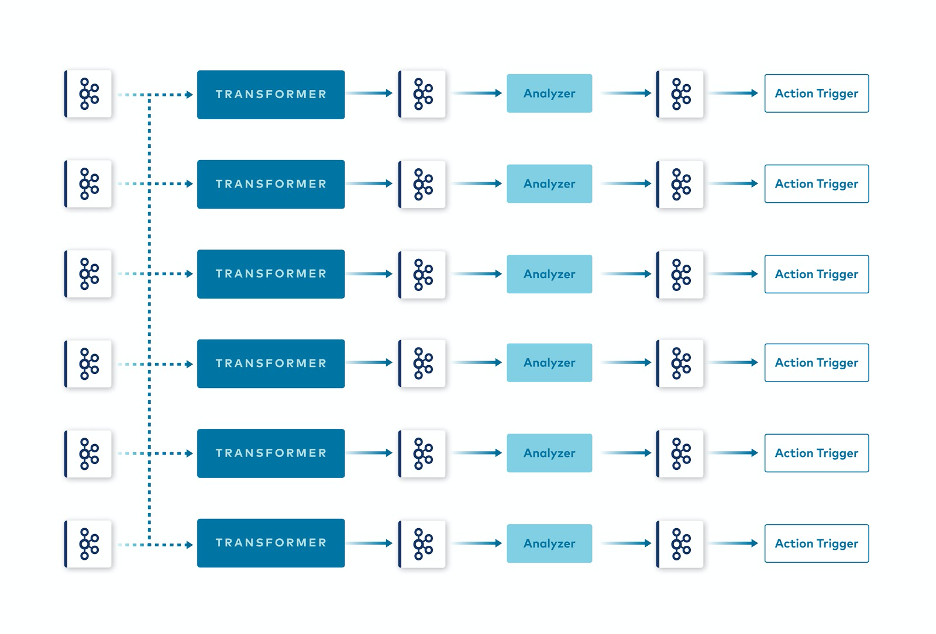
Using that flow, we designed a new data pipeline with finer granularity of services. New pipeline design
The first service in the pipeline, the IP statistics calculator, merges relevant streams together and calculates usage statistics for IP addresses within sliding time windows. It emits statistics to another Kafka topic, from where they are consumed by the IP statistics analyzer, the next stream processor in the pipeline. It checks each statistic event using configured business rules. In case they are met, the statistic is classified as breaching the rules, which triggers publishing yet another event to a topic containing malicious IPs only. That topic is then consumed by a terminal stream processor at the end of the pipeline, the IP Blocker, which performs the blocking action.
| IP usuage statistics | Malicious IP |
{
  "ipAddress": "127.0.0.1",
  "totalCount": 6,
  "failureCount": 3,
  "creationTimestamp": 123456,
  "eventType": "login",
  "failureRatio": 0.5
}
|
{
  "ipAddress": "127.0.0.1",
  "creationTimestamp": 123459,
  "violatedRule": "XYZ"
}
|
Example payloads of published events
As the table above shows, event payloads are really specific to the use case from the beginning—they contain only the data actually needed downstream, without any additional properties. We call this principle minimum value aggregates. Using this approach, we no longer needed to deal with large “elephant” aggregates, as cumulative aggregation functions and windowing were applied at the beginning of the processing pipeline. With this pattern, we observed excellent results in the performance of the platform. Therefore, we decided to make the concept a bit more generic and applied the same pattern on a wider scale to other use cases. Three tiers of services were identified: transformers, analyzers, and action triggers.
 New approach applied to multiple independent pipelines
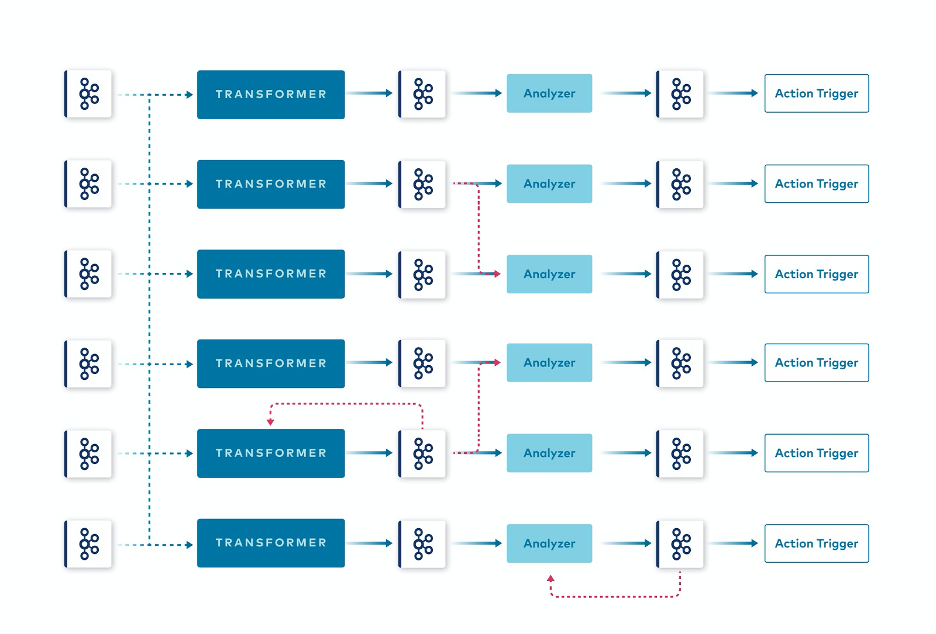
Organising the platform in this way helped us achieve independent, parallel pipelines. This does not mean that all types of dependencies are considered bad practice. Some data pipelines can and even should depend on each other. Part of them may even depend on their own results, being some sort of feedback loop. In comparison to the design of the Session Aggregator, the dependencies here are only partial and explicit and dependent on the use case rather than implicitly forced by a design. This way, the event streaming paradigm is utilized as it should be, as an individual topic that can be consumed by multiple different consumers, which is what Kafka was designed for. Partial pipeline dependencies
Stream processors make use of all the features provided by Kafka Streams and ksqlDB, like co-partitioning, which makes the relevant data from topics to be joined together present in the processor instance’s memory or persistent storage, prior to performing a computation. This feature adds a very important characteristic to the system: data locality. During computation of the join result, no external calls are required, which reduces processing time significantly. For a more detailed explanation of co-partitioning, see the blog post Preventing Fraud and Fighting Account Takeovers with Kafka Streams or watch this Sphere.it conference talk.
Conclusion
By applying a refined design and identifying the primary requirements first, all the drawbacks from the first iteration of the Risk Engine platform were eliminated. There was no longer a single point of failure that could bring the whole platform down, and greater scalability options were unlocked with finer granularity of services. Furthermore, the separation of concerns brought additional benefits to the system’s testability. Specialized stream processors required less memory and CPU units, as the application’s state was not as heavy and the beginning startup time was much faster. This, in conjunction with the Pod’s Persistent Volumes, reduced rebalancing times to insignificant values. These changes, alongside the use of data locality, greatly improved performance and availability of the platform.
Our journey, which is covered in greater detail in the Kafka Summit session Risk Management in Retail with Stream Processing, is still ongoing as the platform evolves. Nevertheless, a few important conclusions can already be drawn.
- First, before jumping into the architecture design or implementation, check your data first and focus on its distribution because this helps to design the data pipeline in a more efficient way and choose the proper event keys and payloads.
- Second, using the minimum value aggregates approach results in multiple benefits and correlates nicely with the Yagni principle for coding. In general, large events, in terms of the size, means more difficult maintenance and tuning. Taking a step back is also a useful technique that allows you to see the architecture and pipelines from the top level in order to identify potential bottlenecks, optimisations, and data streams unification.
- Lastly, having distributed independent pipelines makes the platform scalable, performant, and resilient.
Start building with Apache Kafka
If you want more on Kafka and event streaming, you check out Confluent Developer to find the largest collection of resources for getting started, including end-to-end Kafka tutorials, videos, demos, meetups, podcasts, and more.
Did you like this blog post? Share it now
Subscribe to the Confluent blog
How to Implement Your First ML Function in Streaming
Learn how to add your first ML model to a real-time streaming pipeline. Learn a simple, low-risk pattern for inference, scoring, and deployment with Apache Kafka®.
Sustainable Streaming Architectures: A GreenOps Guide to Efficient, Low-Carbon Data Systems
Design energy-efficient, low-cost streaming systems. Learn GreenOps patterns to reduce compute waste, optimize storage, and lower the carbon footprint of real-time data.

