[Webinar] How to Implement Data Contracts: A Shift Left to First-Class Data Products | Register Now
Intelligently Monitor and Avoid Critical Apache Kafka Issues with Health+
When it comes to alerts, monitoring, and support for Apache Kafka®, how do you know when you’ve got a critical problem that needs your immediate attention?
You likely won’t be sitting in front of a live dashboard somewhere simply waiting for something to go wrong. Your time is best used elsewhere. Instead, you want to have the right alerts already configured for mission-critical Kafka services that identify and notify you of problems as they occur, complete with recommended actions for remediation. Having the right alerts allows you to focus on more important matters—knowing that if an issue does arise, you’ll know immediately.
So, what exactly does success look like when it comes to alerts, monitoring, and support for Kafka with Confluent Platform? There are likely a few steps:
- When you receive an alert, you want to quickly understand where the issue is by jumping into the metrics to diagnose.
- Time-to-resolution is important, so having the right metrics identified in your monitoring dashboards is important to quickly spot patterns, correlations, and ultimately identify where issues are for root cause analysis.
- If you need help troubleshooting or resolving the issues at hand the Confluent Support Team helps get you back up and running as quickly as possible to minimize business-disrupting downtime.
Sounds simple, doesn’t it? We recognize there’s more involved in taking these steps.
For example:
- How do you know which alerts to set up?
- What metrics should you monitor?
- Are you sure you’re alerting on the right metrics to detect issues?
- What metrics thresholds should you be setting in your alerts?
Alerts are notoriously difficult and time-consuming to set up. Additionally, if you add in a new cluster, broker, or other service, you have to repeat the setup process. And don’t forget the metrics that come with upgrades and new features; you need to set up alerts for those, too!
With monitoring dashboards, similar questions arise. Are you displaying the right metrics on your dashboards? How do you tell what is good or bad for a metric? If you’re well-versed in the internals of Kafka, you may already know what all the metrics mean—but as your team grows and brings on new members, providing context and explanation across all of these metrics can be difficult. Collecting and storing metrics can be expensive, too. If you’re hosting your own monitoring solution, storing multiple days, weeks, or months of monitoring data can lead to escalating infrastructure costs.
And last, if you need assistance from the world-class Confluent Support Team, you have to provide a good bit of context so a support engineer can orient themselves and help you resolve the issue. To best support you, the Support Team typically asks for JMX metric dumps, historical values, or configuration files, which takes time to collect, upload, and consume, all before the troubleshooting begins. This takes time and slows down your time to resolution, putting you at increased risk of a business-disrupting downtime.
We make cluster health and monitoring easy for our customers
At Confluent, we’re hyper-aware of the challenges involved in managing alerts, monitoring, and resolution. Over the years, we’ve developed several tools, written blogs and whitepapers, and built a world-class support team, all with the goal of helping our customers keep their mission-critical Kafka systems healthy, and reliably setting their data in motion. Recently, we released a new product for Confluent Platform that took this one step further.
Confluent Health+ provides the tools and visibility needed to best monitor your Kafka environments and minimize business disruptions. Health+ has three main benefits:
- Intelligent Alerts to reduce the risk of downtime and data loss by identifying potential issues before they occur. These alerts are based on expert-tested rules and algorithms developed through years of experience running thousands of clusters in Confluent Cloud.
- Cloud-based monitoring dashboards to ensure the health of your environment(s) and quickly troubleshoot issues through real-time and historical visualizations of monitoring data. This scalable, cloud-based solution also offloads expensive and infrastructure-intensive monitoring of your self-managed services, helping you reduce your monitoring costs by up to 70%.
- Accelerated Confluent support to speed up issue resolution and minimize business disruption with a streamlined support experience. We enable customers to securely share contextual metadata and metrics about their services without manual entry. This helps our Support Team diagnose your issues much quicker to lower your overall time to resolution by up to 30%.
Let’s dig into each of these a bit more.
Intelligent Alerts
When you connect your Confluent Platform service to Health+, all alerts are automatically set up for you, removing the need for you to manually review each metric and set up individual alerts and thresholds. Instead, you simply configure the channel for which you want to be notified, and the severity level of alerts you want to receive. Health+ Intelligent Alerts provide three severity levels to help you prioritize:
- Critical – Issues are present that may limit or prevent data from moving across your cluster. We recommend these be addressed with urgency.
- Warn – Metrics that are close to exceeding their normal operational range and may cause future issues. We recommend these metrics be reviewed expediently along with their recommended actions.
- Info – Informational events on the normal operation of the cluster. We recommend these be reviewed regularly.
To set up a new notification in Health+, you select the severity levels to include and the channel to receive them on. Today we support three channels: Slack, email, and a webhook. The webhook can be used to build additional integrations into other tools as needed.
Today we provide more than 30 Intelligent Alerts in Health+ across various metrics and severities. We’re constantly adding new Intelligent Alerts, while also tuning our existing ones to proactively identify issues. Through our Health+ product backend, we’re able to seamlessly release new alerts as new metrics become available or as clusters are upgraded to new versions—no intervention is needed by users to start tracking the new metrics or to set up new alerts.
Cloud-Based Monitoring Dashboards
Similar to the Intelligent Alerts, when you connect a Confluent Platform cluster into Health+, the monitoring dashboards instantly come to life, showing the active health of the cluster along with a summary of its overall status. When there are issues, the dashboards highlight the trouble areas to help you zero in and diagnose further.
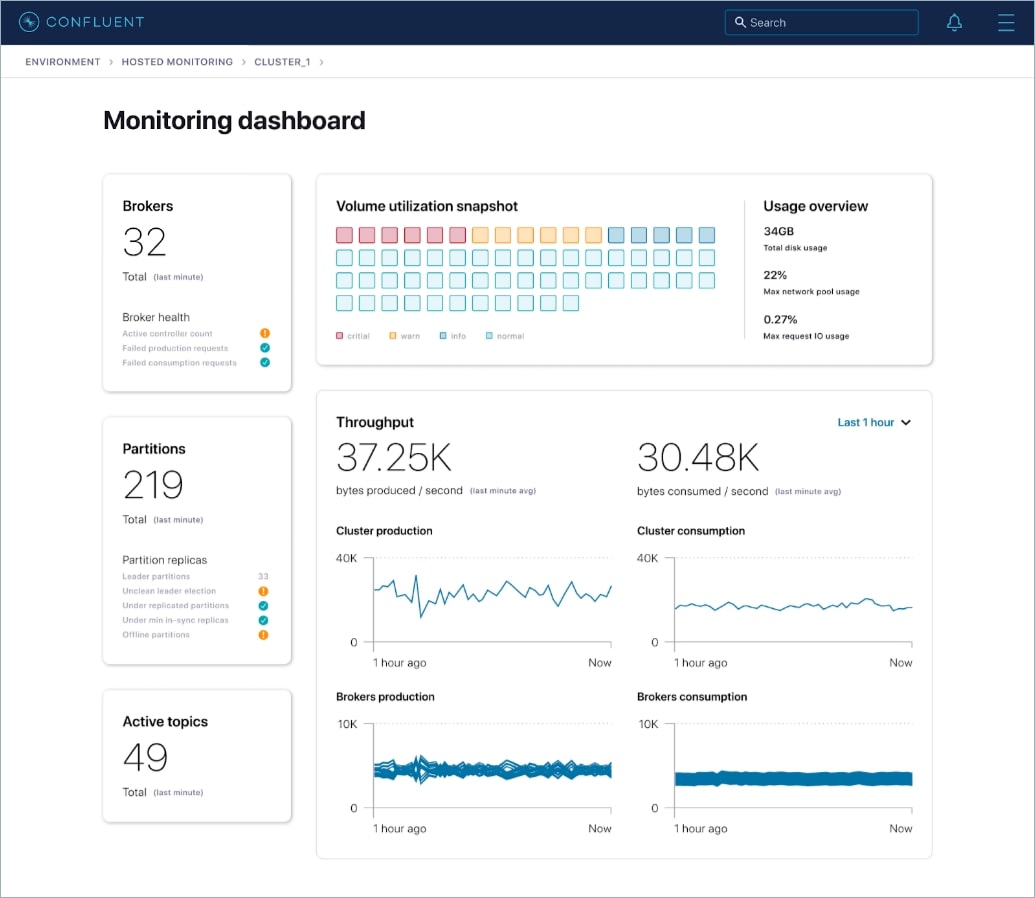
When building Health+ monitoring dashboards, we wanted to ensure that a user wasn’t just thrown into an unwieldy dashboard and left wading through endless pages of metrics. Instead, Health+ surfaces the metrics that matter most and visually indicates where there are potential issues. Each of these metrics can be expanded upon and observed deeper.
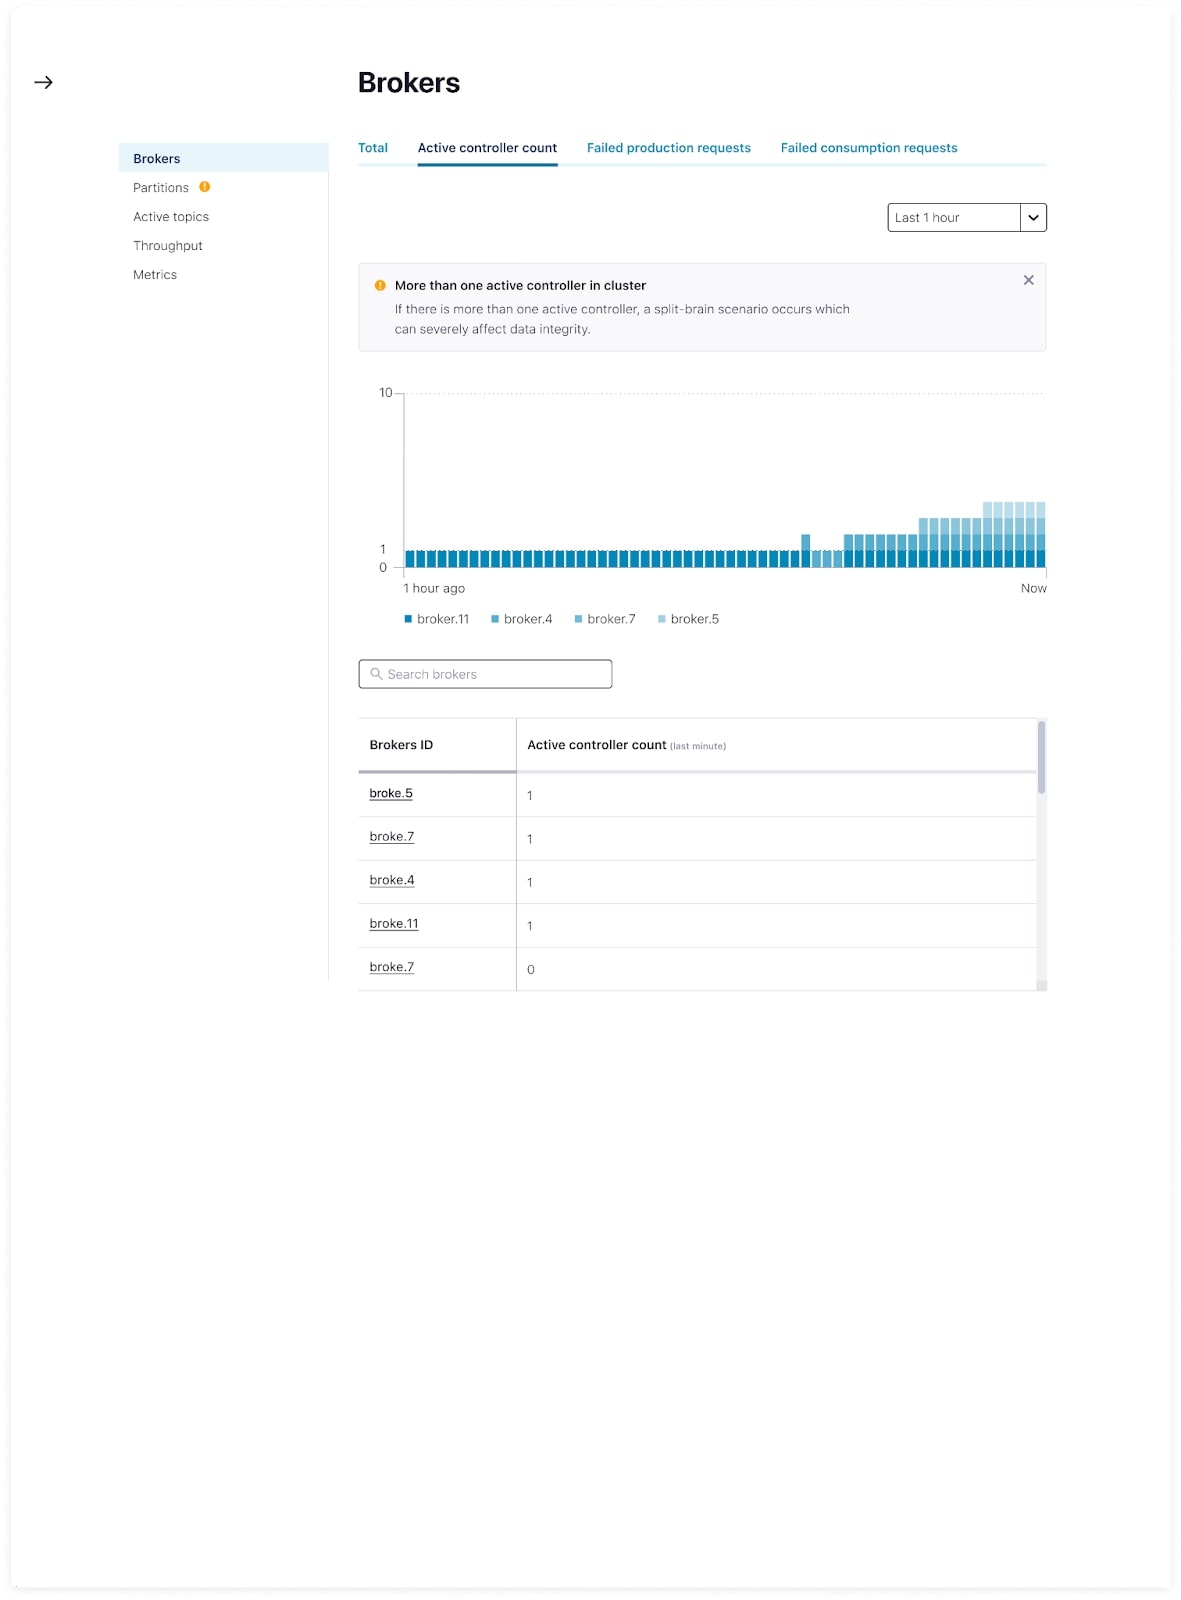
Digging deeper into a metric allows you to observe it over different time periods in order to identify when issues began, and then compare that view against historical trends and other metrics. When Health+ detects that a metric is not in a good state, additional information is shown with the metric to offer an explanation as to what the metric means and recommended steps for addressing the underlying issue.
As new features and metrics are added to Confluent Platform, the Health+ dashboards automatically update depending on the version you’re on without any additional configuration needed on your end.
Accelerated Confluent Support
And finally, when you do reach out to Confluent Support for additional help and troubleshooting, our team is able to view the same monitoring details you see in Health+ and address your issues quicker. Instead of you needing to capture and upload JMX metrics and broker configuration details, our team is able to view metrics in real time along with the historical details, all with the goal of speeding your time to resolution.
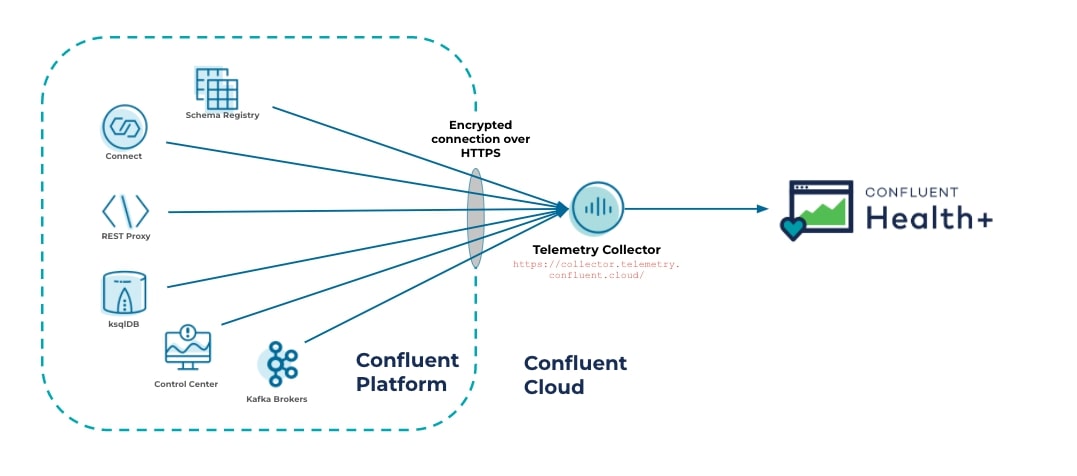
How does Health+ work?
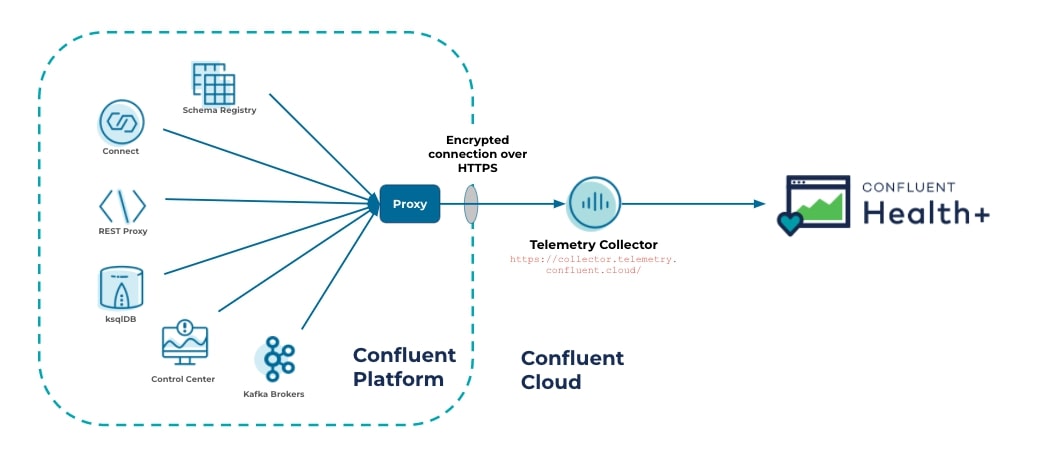
Health+ works by sending telemetry data from your Confluent Platform components to the Telemetry Collector in Confluent Cloud. Each Confluent Platform component has the Telemetry Reporter plugin pre-installed. Once configured, the Telemetry Reporter sends monitoring data over an encrypted HTTPS connection to the Telemetry Collector located at https://collector.telemetry.confluent.cloud/ for collection and storage against your organization.
Similar to other cloud-hosted monitoring tools, setting up Health+ requires allowing for outbound traffic from your Confluent Platform components to enable the telemetry data to be sent. For ease of setup, the Telemetry Reporter also supports routing traffic through a proxy with only outbound access allowed.
What data is sent to Confluent when using Health+?
“Data” can be broken into two main categories:
- Message content refers to data sent to and stored on Kafka topics. This is the message-level data your organization processes using applications that are built on top of Kafka.
- Telemetry data refers to data about the health and operational status of your Kafka services. This data doesn’t contain any message content. This information is typically requested by Confluent’s Support Team when troubleshooting an issue with you.
All data captured by the Telemetry Reporter is thoroughly detailed in our documentation. Each metric that we capture is accompanied by a description of the metric, along with the version of Confluent Platform from where we started capturing.
What about other security questions/concerns?
We built Health+ with the utmost security-conscious customer in mind and understand you or your Infosec team may have questions. Confluent Health+ FAQs has helped many of our customers address most of the common questions that come up. If you have additional questions not addressed in this document, please reach out to our support team at support@confluent.io.
Potential infrastructure savings for self-hosted monitoring
If you run Confluent Control Center or another self-hosted monitoring platform today to track your Confluent Platform metrics, you’re probably aware of the infrastructure costs associated with storing all of the historical monitoring data. This monitoring data accumulates over time and can exponentially increase as you add in new clusters and services. With Health+, you no longer need to store monitoring data on your own infrastructure. If you’re currently using Confluent Control Center, Reduced infrastructure mode can be enabled for continued use of Control Center for all management capabilities in Confluent Platform, while disabling the heavy-weight monitoring features in favor of Health+. In this mode, Control Center’s system requirements can be greatly reduced. We estimate that customers who leverage Reduced infrastructure mode along with Health+ will see ~70% savings in infrastructure costs.
Getting started with Health+ is easy
Health+ is simple (and free) to get started. When you sign up for Health+, you are quickly guided through the necessary steps to generate your secure credentials and set up the Telemetry Reporter on each of your Confluent Platform components. Get started today and say goodbye to endless troubleshooting and costly downtime!
Did you like this blog post? Share it now
Subscribe to the Confluent blog


Confluent and Amazon EventBridge for Broad Event Distribution
Learn how to stream real-time data from Confluent to AWS EventBridge. Set up the connector, explore use cases, and build scalable event-driven apps.


New With Confluent Platform 8.0: Stream Securely, Monitor Easily, and Scale Endlessly
This blog announces the general availability (GA) of Confluent Platform 8.0 and its latest key features: Client-side field level encryption (GA), ZooKeeper-free Kafka, management for Flink with Control Center, and more.