[Virtual Event] Agentic AI Streamposium: Learn to Build Real-Time AI Agents & Apps | Register
What Is Data Flow? Key Concepts & Best Practices
Data flow refers to how data moves through information systems, including databases, data lakes and warehouses, and data processing engines like Apache Spark™ or Apache Kafka®. Also referred to as data movmement, data flows act as a roadmap and show where data goes within an organization and how it changes along the way.
Data flows play an important role in data flow programming—a style of coding focused on building systems designed for the careful data governance, handling, and movement through various steps.
By using data flow programming, you can create complex systems that efficiently process data and show how it is transformed and acted upon at each step. Learn more about how to build data pipelines that accelerate data flows while increasing data integrity to help you maximize data flows.
How Data Flows Work
Data flow is an important concept in computing that defines the movement of information within a system's data architecture through processing nodes, components, or modules.
A data flow typically begins with data ingestion, acquisition, or input (i.e., where the data comes from). The flow continues outlining how the data changes via subsequent data processing operations. This includes steps to transform data, such as aggregation, filtering, and computation—as well as how and when to store the data, how it's exposed via dashboards and other applications, and how it is used and accessed further downstream.
Finally, the data flow shows where and how the data is delivered to its destination. Data flow architectures may contain both intrasystem scenarios (where data remains within a single application or infrastructure) and intersystem or even inter-organizational data movement scenarios (where data flows between interconnected systems).
Key Elements of Data Flow Systems
An efficient data flow system requires data consistency, latency, error handling, and synchronization. As such, these are the most common technologies needed to manage and implement data flow:
- Batch processing frameworks process and analyze a set of data that has been stored over a period of time.
- Stream processing platforms continuously capture, store, and process data streams.
- Event-driven architectures permit systems to detect, process, manage, and react to real-time events.
- Data pipelines move data from one location to another.
Proper data flow design is key in optimizing data processing efficiency, reducing bottlenecks, and ensuring the reliable delivery of information within complex computing environments.
Data Flow Benefits and Use Cases
Whether you’re mapping a computer network or drawing directions to your house, data flows help you visualize and understand the flow of information. Understanding where and how data is enacted upon within a network allows you to thoroughly model and evaluate new systems and to examine existing ones.
Here are five benefits of implementing efficient data flow within a system:
Optimized Data Processing
Properly structured data flow enables the efficient movement of data through various processing stages. This optimization reduces unnecessary data transfers, transformations, and computations, resulting in faster and more streamlined data processing.
More Efficient Resource Utilization
Data flow facilitates resource allocation by ensuring that processing resources are utilized effectively. It prevents resource overload by distributing data processing tasks based on the available capacity, thus maximizing system performance and minimizing latency.
Improved Scalability
Well-designed data flow architectures can scale horizontally or vertically to accommodate increasing data volumes and processing demands. This scalability ensures that systems can handle growing workloads without sacrificing performance or responsiveness.
Real-Time Insights
Data flow mechanisms can support real-time processing and analysis, enabling organizations to gain immediate insights from incoming data. This is especially critical in scenarios like IoT applications, financial trading platforms, and monitoring systems, where real-time decision-making is essential.
Error Detection and Handling
Clear data flow pathways make it easier to identify and address errors or anomalies in data. By implementing checkpoints, monitoring points, and error-handling mechanisms along the data flow route, organizations can enhance data quality and reliability.
In essence, a well-defined data flow enhances the overall efficiency, scalability, responsiveness, and reliability of computational systems, enabling organizations to harness the full potential of their data for informed decision-making and strategic planning.
Common Challenges With Data Flow Design
Data flow diagrams can be used for numerous purposes, including software engineering, hardware installation, business analysis, agile development, and system structures.
In any case where the system needs to be explained, including proposing a new system and auditing an existing system, a data flow diagram can be helpful in conveying concepts. This includes presentations to the C-suite or stakeholders, requests for additional system assets, proposals of changes to existing systems, and auditing systems for regulatory compliance.
Data flow diagrams use symbols, such as arrows, to indicate the direction of traffic, plus short-text labels to indicate inputs, outputs, and storage points. They’re popular due to their ability to convey information in an easily digestible manner to both technical and non-technical audiences. As visual creatures, humans rely on data flow diagrams to understand the flow of information within a system.
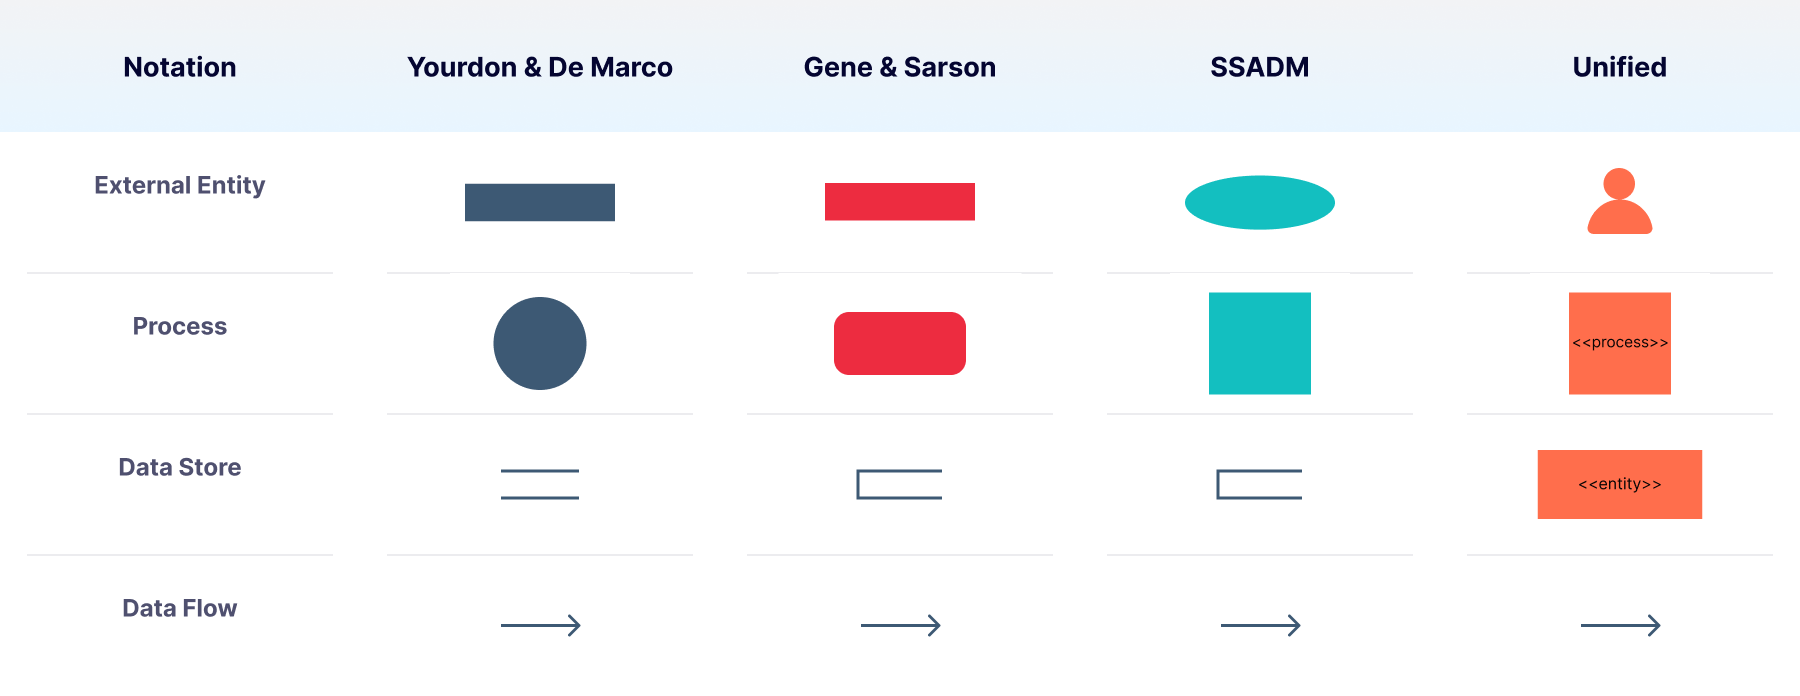 *Common representations used for the 4 primary notations included in data flow diagrams: external entity, process, data store, data flow.
Here are five challenges commonly associated with managing data flow:
Data Consistency and Integrity
Ensuring data remains consistent and accurate as it flows through various processing stages can be challenging. Synchronizing data updates, dealing with concurrent modifications, and avoiding data corruption are crucial considerations.
Latency and Real-Time Processing
In scenarios where real-time data processing is essential, managing low-latency data flow becomes a challenge. Minimizing the time it takes for data to traverse the system while maintaining accuracy and quality requires careful architecture and optimization.
Data Security and Privacy
As data moves between different processing points, ensuring its security and maintaining user privacy become significant challenges. Encryption, access controls, and secure data transmission mechanisms are necessary to mitigate risks.
Complexity in Scaling
While data flow architectures can be designed to scale, managing the scaling process itself can be complex. Handling load distribution, resource allocation, and maintaining consistent performance across scaling instances requires careful planning.
Error Monitoring and Remediation
Detecting errors and anomalies in data flow, as well as implementing effective error-handling mechanisms, is essential. This becomes challenging in large and intricate data flow scenarios where pinpointing the root cause of an issue can be time-consuming.
Data Flow Diagrams & Design

Data flow diagrams (DFDs) are graphical representations, which describe the processing of data and its movement through a system or a process. They give a definite picture of how data is fed into a particular system, how it is processed, where it is stored, and how again it is retrieved. They are vital in understanding the systems and their efficiency.
Data flow diagrams vary in detail depending on the scope of the system and the complexity being communicated via the diagram. In general, the simplest form of data flow diagram is a Level 0 diagram.
Level 0 data flow diagrams, also called context diagrams, convey high-level information about a system. It’s a basic overview of a system or design, intended to be understood by non-technical audiences such as business analysts. As the levels increase, they become progressively more detailed in scope and drilled down to specific data stores and processes. A Level 3 data flow diagram is highly unusual, as the complexity required for it defeats the purpose of the diagram—which is to simplify a process for ease of consumption by non-technical audiences.
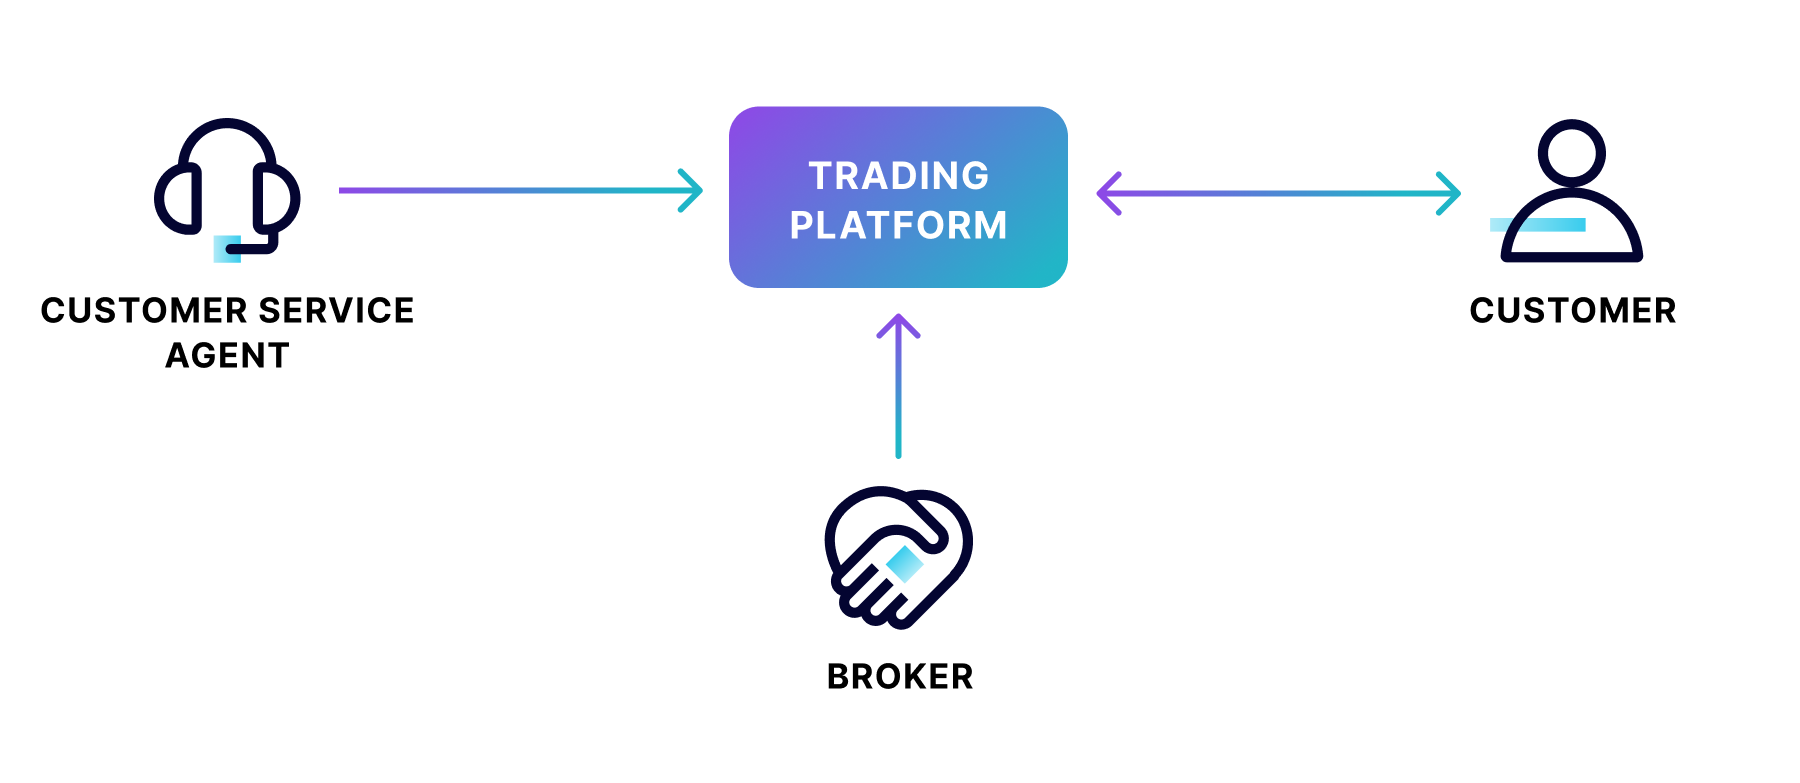 Level 0 Data Flow Diagram Example
In the above example of a securities trading software, data flows in one direction from the broker and the customer service agent to the trading platform data store. Data flows in both directions between the customer and the trading platform.
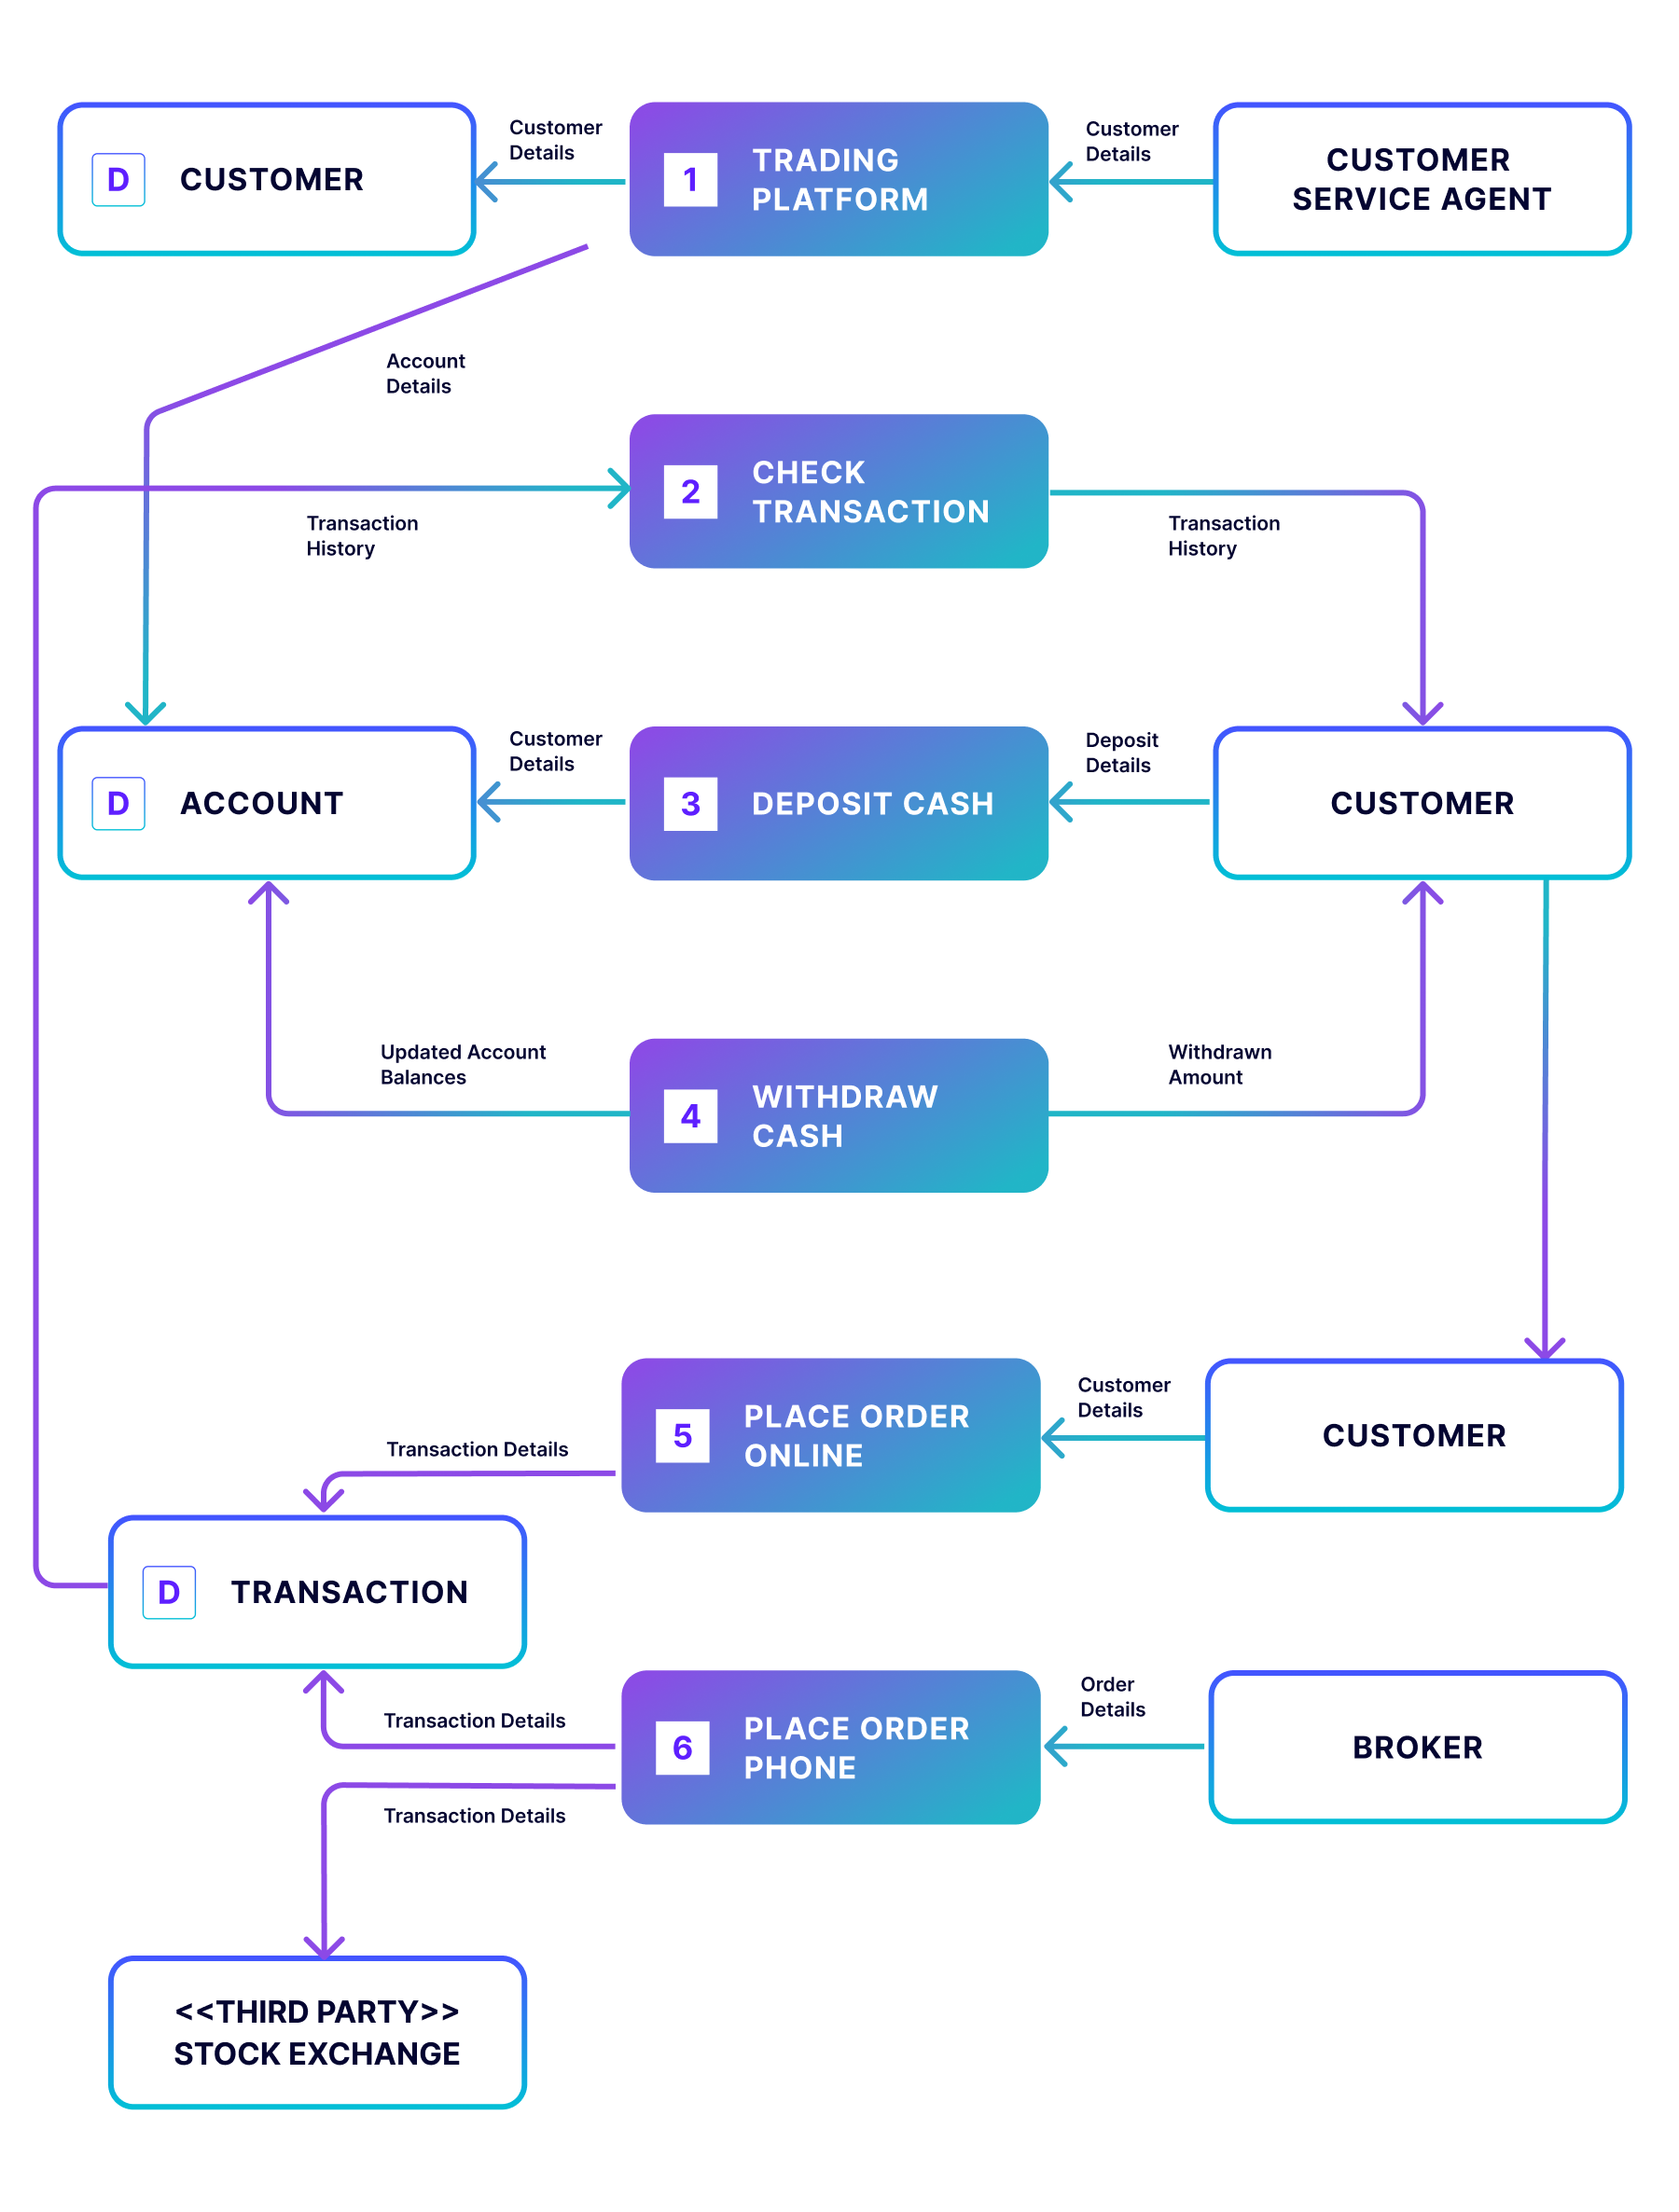
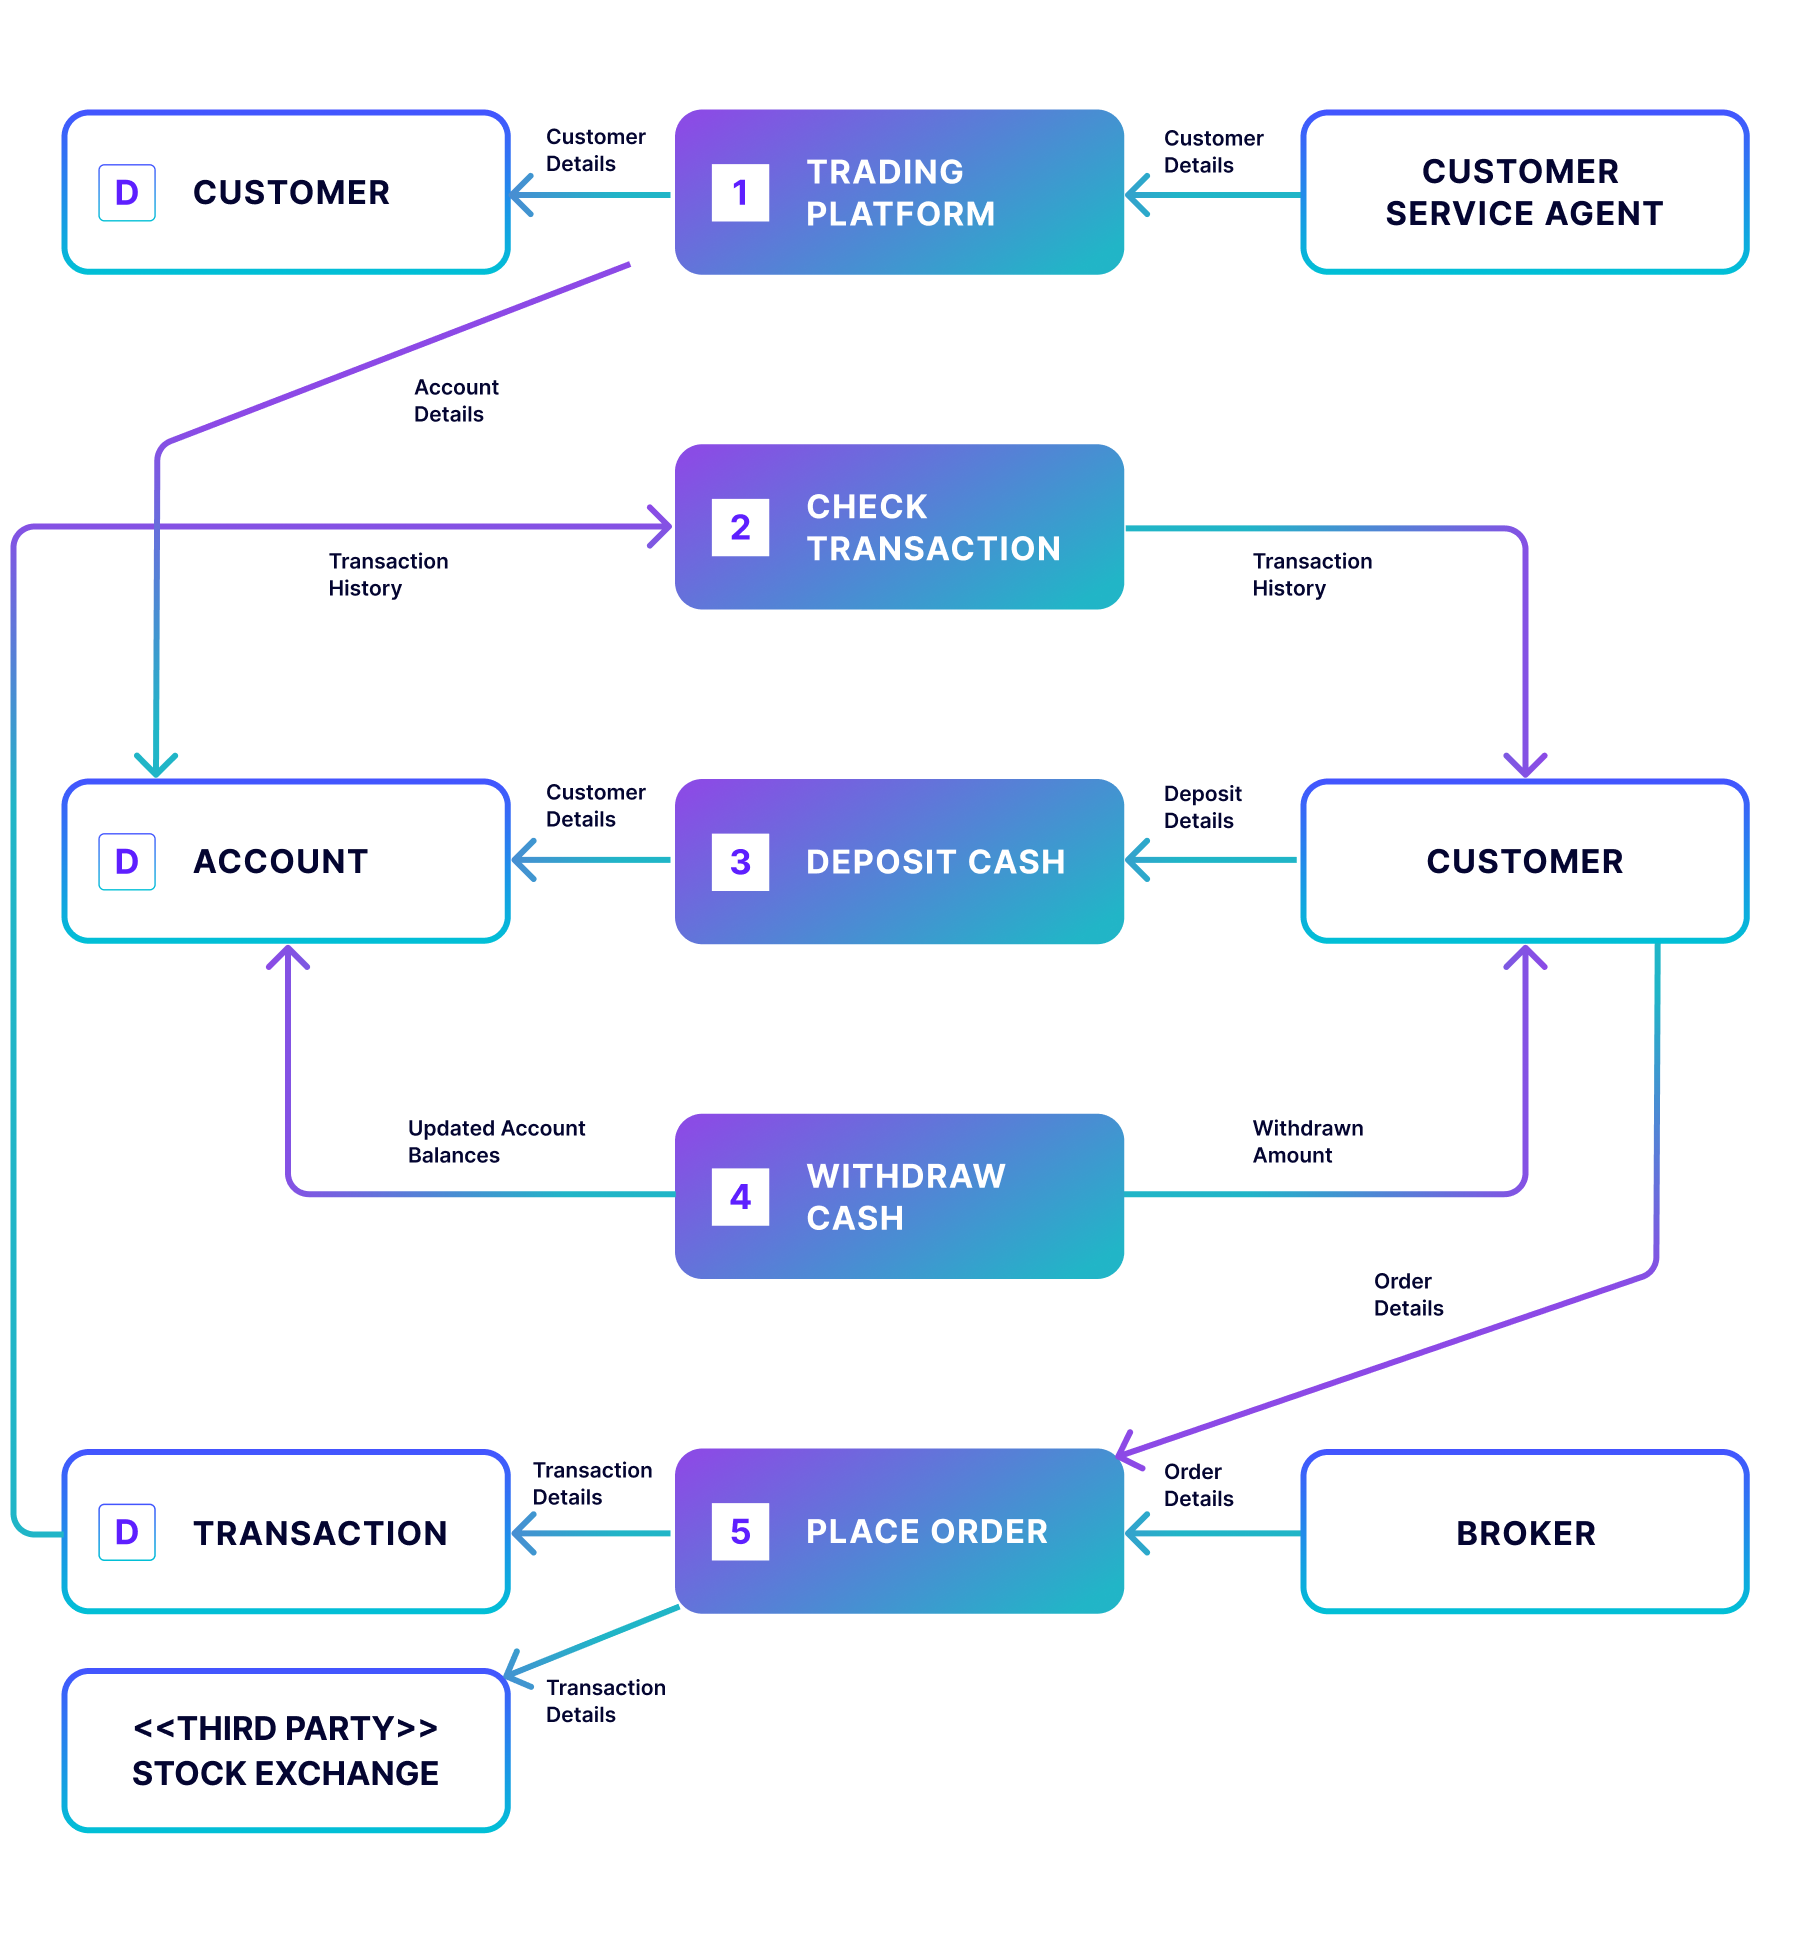 Level 1 Data Flow Diagram Example
The Level 1 version of this securities trading software breaks the processes into more detail, highlighting the main functions carried out by the system.This allows viewers to understand the process in its entirety, including the types of transactions the customer can engage in. Level 1 is the most common type of data flow diagram used.
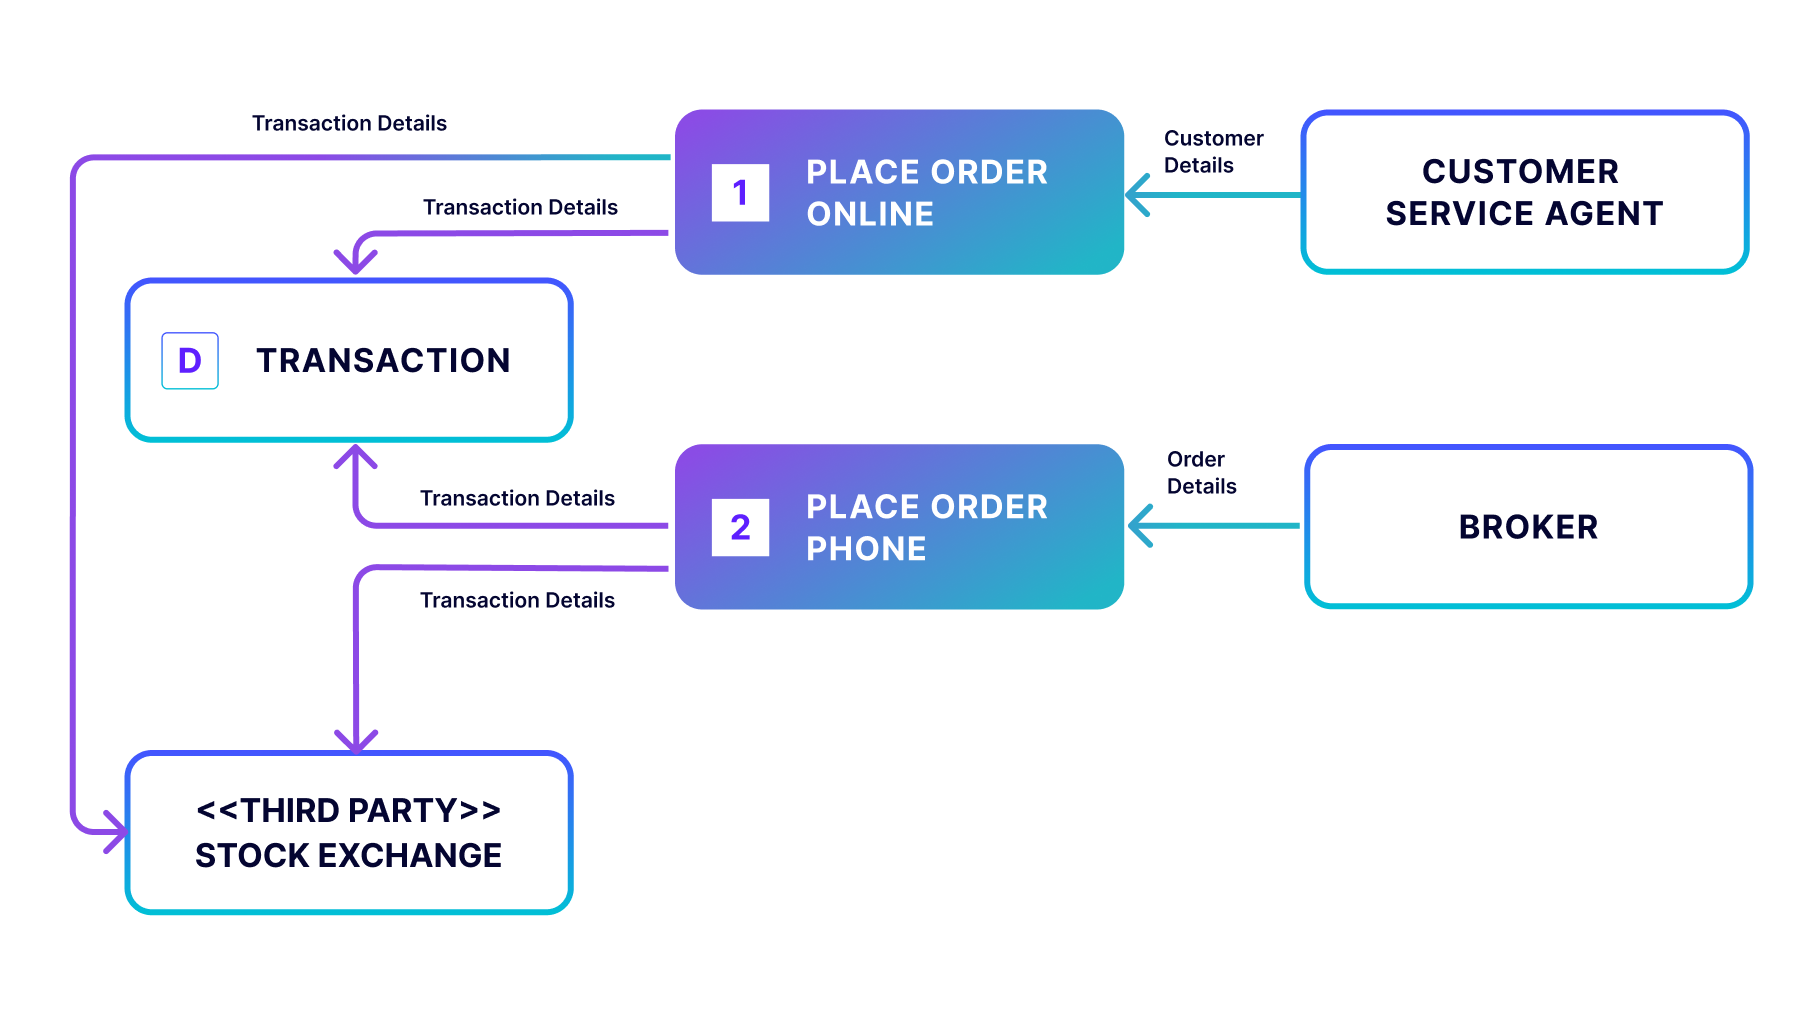 Level 2 Data Flow Diagram Example
In the Level 2 data flow diagram, a more granular depiction of a specific process is the goal. In this case, the “Place Order” process is the piece we’re focusing on with the inclusion of the external entity stock exchange. Although the diagram is less busy than in Level 1, it’s a zoom-in on a specific part of the process, and therefore, a Level 2.
 Level 3 Data Flow Diagram Example
In the less-common Level 3 data flow diagram, the specific process of “Place Order” is further expanded to show the options available when placing an order online, such as purchasing, selling, and transferring. As you can imagine, this level of detail for the entire process becomes text-heavy and difficult to read. Thus, this level is generally reserved for activities such as mapping out new networks, most often performed by qualified system engineers.
Tools and Programs for Designing Data Flow Diagrams You can use a variety of tools to craft a data flow diagram, including Adobe Acrobat, SmartDraw, Lucidchart, Miro, and Canva.
Additionally, Confluent Cloud for Apache Flink® produces data flow diagrams to model every phase of the data flow and how data is processed in real-time streaming functionalities. In this way, constructing the diagrams allows the design of effective data flow systems to achieve highly reliable and easily scalable results.
Key components of a DFD include:
External entities
Illustrate entities that exist outside of the system that act as the source and or destination of data as rectangles.
Processes
These are represented in the figure by circles or ovals to indicate the processing or changed form of data within the system.
Data stores
These are illustrated as open-ended rectangles and are the locations where information is stored for later use.
Data flows
Lines connecting data entities indicating data flow from one entity to the next from an entity to a process or from a process to an entity.
Levels of DFDs
There are two different levels of DFDs, each providing varying degrees of detail:
Level 0 DFD (Context Diagram): These diagrams provide a big picture at once, presenting the system as a single process with interconnections with other systems and objects that is also oriented more to the data conversion rather than the inner process description.
Level 1 DFD: These divide the single process in Level 0 into sub-processes and consequently describes the flow of data within the system in detail.
For example, ksqlDB in Confluent Cloud produces DFDs to model every phase of the data flow and how data is processed in real-time streaming functionalities. In this way, constructing the DFDs allows the design of effective data flow systems, having highly reliable and easily scalable results.
Build Scalable, Real-Time Data Flows With Data Streaming
Building complex data flows capable of processing and governing data in real time is challenging enough. But these days, most developers are expected to build their organization’s mission-critical applications and services in the cloud.
Many companies that have adopted Apache Kafka® to modernize their data flows have realized just how much time and attention it takes to deploy, monitor, and manage the distributed data streaming engine in the cloud. The Confluent data streaming platform offers modern organizations a way to spend more time building and leveraging modern data pipelines instead of focusing on Kafka operations.
Apache Kafka and Kora: What's the Difference?
Confluent Cloud, our cloud deployment, is built around Kora, our cloud-native Kafka engine that serves up the Kafka protocol for our thousands of customers and their tens of thousands of clusters.
Apache Kafka is a distributed streaming platform that excels in handling high-throughput, real-time data streams. Kafka's architecture and storage mechanism allow it to scale horizontally to accommodate massive data volumes and diverse workloads. With Kora, we’ve fully reinvented Kafka for the cloud to provide a fully managed platform that is more elastic, reliable, and performant than other Kafka services or self-managed data streaming platforms.
Here are five ways Confluent’s cloud-native data streaming platform and its capabilities enable scalable, real-time data flows:
Partitioning and parallelism
Confluent employs data partitioning and parallel processing techniques, allowing data to be split into multiple partitions and processed concurrently. This design promotes efficient utilization of resources and ensures low-latency data flow, crucial for real-time processing.
Event-driven architecture
Confluent supports event-driven architectures, where data flows in response to events or triggers. This design ensures that data processing is initiated as soon as new data arrives, enabling real-time insights and timely actions the second an event happens.
Streaming ecosystem
Confluent provides a comprehensive ecosystem of tools and technologies that complement Kafka's core capabilities. These include 120+ pre-built Kafka connectors for seamless integration with various data sources and sinks, Apache Flink for stream processing, and Stream Governance for built-in data governance and self-service data discovery.
Scalability and replication
Confluent offers features like automatic partition rebalancing and data replication across clusters. This ensures that as data flow demands increase, the system can distribute the load efficiently while maintaining data reliability and availability.
In summary, Confluent's foundation in Apache Kafka, combined with its focus on event-driven architecture, stream processing capabilities, and scalability features, empowers organizations to establish robust, scalable, and real-time data flows that unlock data value across their business.