New in Confluent Cloud: Making Data & Pipelines Accessible for AI-Ready Streaming | Learn More
Apache Kafka Lag Monitoring at AppsFlyer
This article covers one crucial piece of every distributed system: visibility. At AppsFlyer, we call ourselves metrics obsessed and truly believe that you cannot know what you cannot see.
We provide rich dashboards, collect and visualize logs, simplify the creation of client-level metrics, and create a holistic overview of systems in order to detect and debug problems, analyze performance, and identify long-term trends.
Unfortunately, we had an internal blind spot that made it more challenging to deliver these products: we lacked a human-readable and actionable Apache Kafka® lag monitoring system.
Apache Kafka at AppsFlyer
AppsFlyer is a SaaS mobile marketing, analytics, and attribution platform. We help app marketers make better decisions on their running campaigns using a variety of tools found in our platform.
Since 2014, Apache Kafka has served as a core piece of AppsFlyer’s large-scale event-driven architecture, running data pipelines that stream tens of billions of events on a daily basis. AppsFlyer leverages Kafka in a number of ways, with Kafka running our most important workflows. If data is the blood of AppsFlyer, then Kafka is our circulatory system.
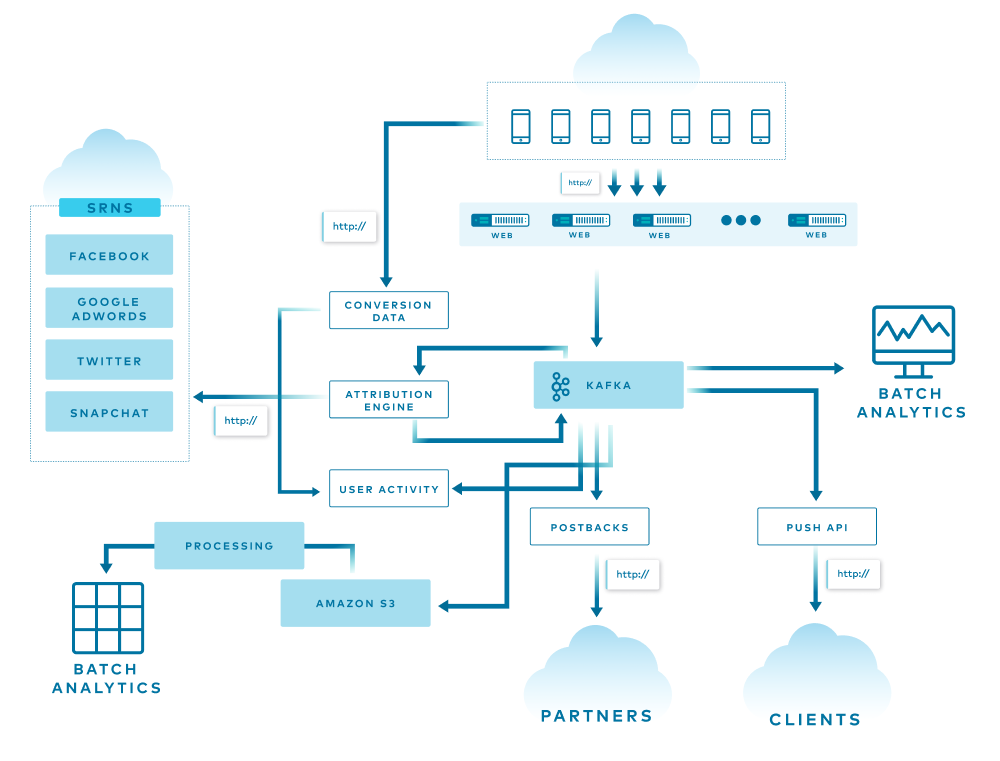
The diagram above is a simple overview of AppsFlyer’s architecture, and each line represents a different flow in the system. Some of the data is used, replicated, and enriched, while other data is stored in various databases for attribution, batch analytics, and more. At the end of the funnel are two services that consume all the data from the end-of-the-line Kafka clusters and store it into S3 using an in-house streaming service and Pinterest Secor.
All of this is translated into more than 1 million incoming HTTP requests per second and 150+ billion events per day spread across more than 20 Kafka clusters.
Before going into more detail, let’s first go over some basic Kafka terms and concepts.
Kafka basics
Kafka is used for building real-time data pipelines and event streaming applications. An offset is a simple integer that Kafka uses to identify a position in the log. Lag is simply the delta between the last produced message and the last consumer’s committed offset. Today, offsets are stored in a special topic called __consumer_offsets. Prior to version 0.9, Kafka used to save offsets in ZooKeeper itself.
In the Offset Management proposal document, the Kafka Core team describes this implementation as a kind of “marriage of convenience” since Kafka is already heavily dependent on ZooKeeper for various purposes like cluster membership, elections, and configuration storage. Now, there are few services that implement their own offset management and store it in ZooKeeper itself. A good example of this is Pinterest Secor, as mentioned earlier.
There is, however, a flaw with this implementation: The problems associated with it become more apparent when you use thousands of partitions and hundreds of consumers. ZooKeeper is not built to serve high-write load such as offset storage. Therefore, the Kafka Core team decided to create a new special topic called __consumer_offsets. This topic allows offset management to be consistent, fault tolerant, and partitioned across the Kafka cluster itself. In fact, one of the most anticipated Kafka Improvement Proposals (KIPs) is KIP-500, which will remove the dependency on ZooKeeper completely. After KIP-500 is implemented, Kafka will manage its own metadata internally in a more scalable and robust way, and it will omit the option to use ZooKeeper-based consumers.
How does offset storage work?
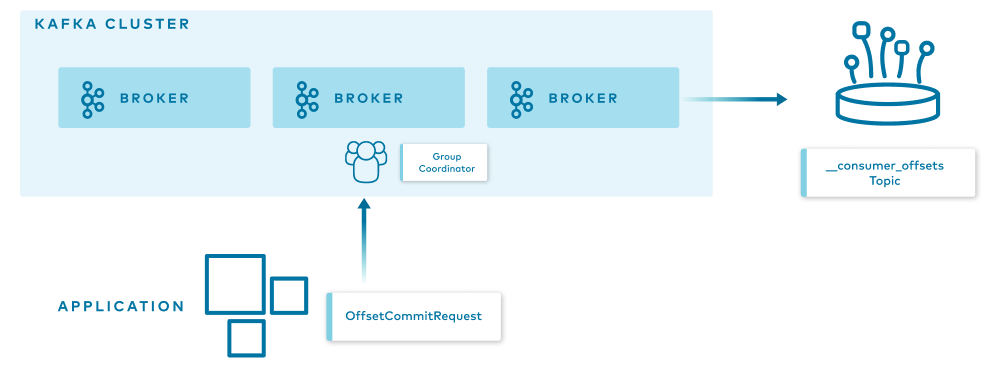
When the group coordinator—a broker that is selected to manage the state of a given consumer group—receives an OffsetCommitRequest by the application, it appends the request to the __consumer_offsets topic, which is then replicated to other Kafka brokers in the cluster based on the offsets.topic.replication.factor config parameter. This specifies the replication factor of the offset topic and affects the amount of brokers the offset commit will be replicated to.
The offset commit can be controlled from the broker configuration. You can set the offsets.commit.required.acks, which stands for the number of acknowledgments that are required before the offset commit can be accepted, as well as offsets.commit.timeout.ms, which defaults to five seconds.
The simplest way to check the offsets and lag of a given consumer group is by using the CLI tools provided with Kafka.
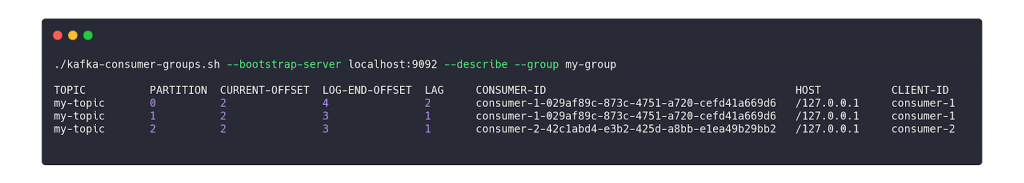
In the diagram above, you can see the details on a consumer group called my-group. The command output shows the details per partition within the topic. Two main columns that are worth mentioning are the CURRENT-OFFSET, which is the current max offset of the consumer on a given partition, and the LOG-END-OFFSET, which is the offset of the latest message in the partition.
Why does lag matter?
Why does lag matter and why does it need to be treated differently than other metrics in the system?
Lag is a key performance indicator (KPI) for Kafka. When building an event streaming platform, the consumer group lag is one of the crucial metrics to monitor.
As mentioned earlier, when an application consumes messages from Kafka, it commits its offset in order to keep its position in the partition. When a consumer gets stuck for any reason—for example, an error, rebalance, or even a complete stop—it can resume from the last committed offset and continue from the same point in time.
Therefore, lag is the delta between the last committed message to the last produced message. In other words, lag indicates how far behind your application is in processing up-to-date information.
To make matters worse, remember that Kafka persistence is based on retention, meaning that if your lag persists, you will lose data at some point in time. The goal is to keep lag to a minimum.
What did we have?
A few years ago, when Kafka became a crucial piece of AppsFlyer’s infrastructure, we created a Clojure service called Kafka-Monitor. It was essentially a simple wrapper around the built-in Kafka CLI tools that were mentioned before, which parsed the values and sent it to our metrics stack. Although it worked fine, it was hard to maintain, error prone, and not scalable at all.
We also recognized that something was missing. Just imagine a situation where you get a PagerDuty alert on Kafka lag in the middle of the night. You barely wake up, open the laptop lid, and try to understand what’s going on in your system.
In such a scenario, the last thing that you want to do is to start debugging and calculating the lag, calculating the retention time, and figuring out what you should do next.
This information should already be as descriptive, clear, and actionable as possible. The fact that the lag is represented by a number means very little. Does a 40,000 message lag mean five seconds? Five minutes? Is there a risk of losing data because of retention?
This was the blindspot that needed to be addressed.
What did we want to achieve?
When planning for a better solution for lag monitoring, the following needs were defined for the new solution:
- Automation: We wouldn’t need to change config files and deploy the service every time a new consumer group that we want to monitor starts to consume from the cluster.
- Regex filter: We want the ability to control which consumer group to monitor based on a predefined regular expression (e.g., filter out test consumers, and the console_consumers).
- Support ZooKeeper consumers: We want a solution that will track both __consumer_offsets as well as ZooKeeper consumers.
- Scalable: AppsFlyer scale continues to grow every single day. Thus, we need a solution that will scale and has a small footprint so we can deploy it for each cluster and scale it horizontally as needed.
From a metrics perspective, we wanted the ability to control and build our own calculations and alerts because we use Kafka for different use cases and have different monitoring stacks. The raw metrics that we searched for included per-partition, per-consumer-group, and per-topic metrics. These metrics provide flexibility for lag monitoring and alerting, and help create lag monitoring that actually means something.
What options did we consider?
With those guidelines, we started to explore and test a few of the available solutions.
The prominent ones were:
Kafka Lag Exporter
Kafka Lag Exporter had native Kubernetes support and contained time-based lag monitoring out of the box. At the time, it was in beta and it didn’t fit our predefined guidelines.
Remora
Remora was created after Zalando spent some time using Burrow. It has Datadog and CloudWatch integration, and it’s a wrap around the Kafka consumer group command—which we already had.
Burrow
Burrow is an active LinkedIn project with more than 2,700 stars on GitHub. It has an active community, Gitter channel, great wiki page, and multiple extension projects. Burrow is battle tested and works in production at LinkedIn.
We chose Burrow because it answered all our needs, including tailor-made metrics calculations, providing enough flexibility to expose the metrics at different levels, and calculating lag time. At the current time, we are also considering Confluent Platform, because it provides many components that we would otherwise need to build and implement on our own. Confluent Platform also includes Confluent Control Center, which is another monitoring tool for Apache Kafka.
So, what is Burrow?
Burrow
Burrow is a monitoring solution for Kafka that provides consumer lag checking as a service. It monitors committed offsets for all consumers and calculates the status of those consumers on demand. The metrics are exposed via an HTTP endpoint.
Burrow also has configurable notifiers that can send status updates via email or HTTP if a partition status has changed based on predefined lag evaluation rules.
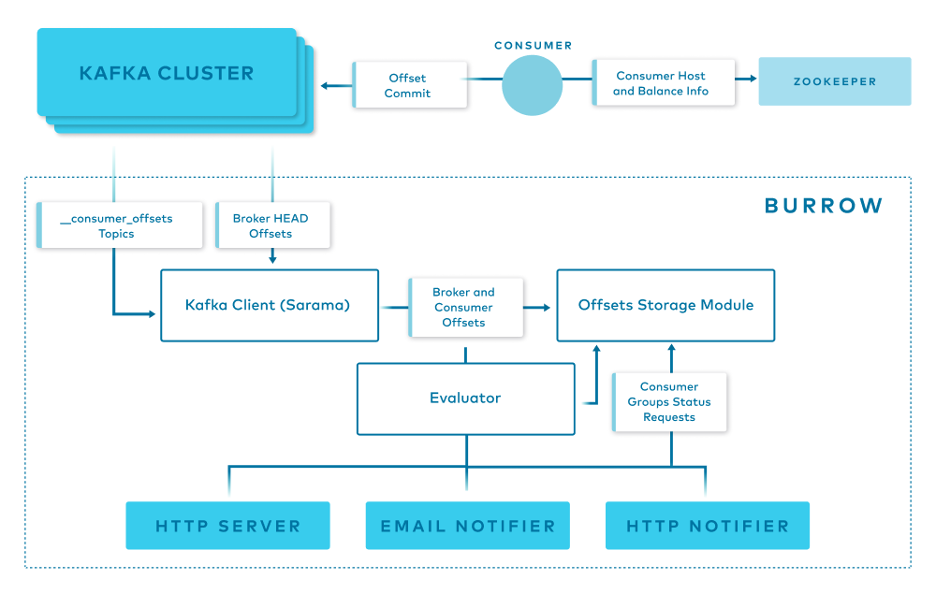
Burrow has a modular design and consists of the following components:
- Clusters/Consumers subsystem runs a Kafka client (Sarama) that periodically updates cluster information and consumes from the __consumer_offsets topic and from ZooKeeper.
- Storage subsystem stores all of Burrow’s information. Burrow relies on ZooKeeper as well to store metadata for modules and provide locking between multiple copies of Burrow.
- Evaluator subsystem retrieves the information from the storage subsystem and calculates the status of a consumer group based on predefined lag evaluation rules.
- Notifier subsystem fetches the status of consumer groups and notifies via HTTP, email. or another predefined method.
- HTTP server exposes an HTTP endpoint for Burrow.
How do we use Burrow?
Burrow’s modular design and small footprint allow us to deploy it easily and efficiently to monitor a single Kafka cluster or a cluster group.
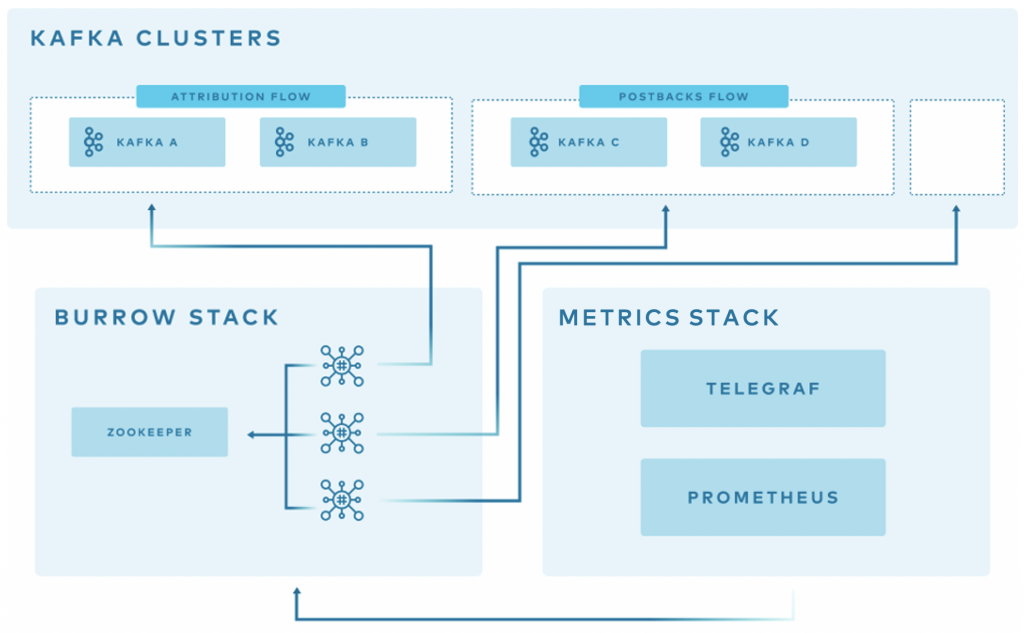
Above is an overview of how Burrow is deployed at AppsFlyer.
At AppsFlyer, Kafka clusters can be grouped logically and monitored together using Burrow. Using our in-house deployment system, we deploy three copies of Burrow in separate availability zones to monitor each cluster group. Each of them has a healer and autoscaler configured in our orchestration system based on a threshold.
The Burrow instances are connected to the same ZooKeeper ensemble. Each one of the Burrow instances exposes an HTTP endpoint where our metric stacks read or receive from, depending on if it’s Prometheus or Telegraf.
Burrow dashboards
Burrow exposes different sets of raw metrics, which gives us the flexibility to create tailor-made dashboards and alerts.
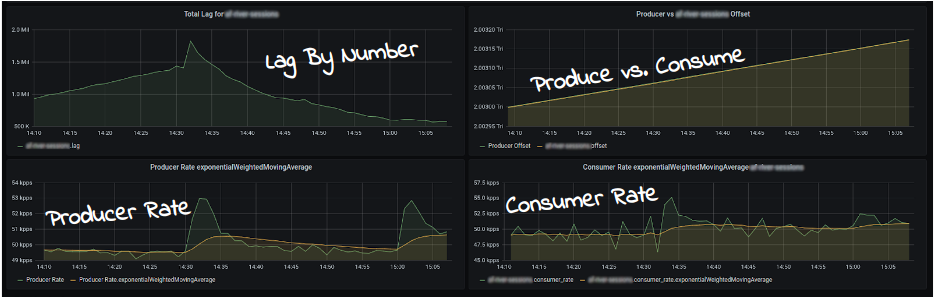
This dashboard enables us to visualize the lag by number of messages, the producer rate, the consumer rate, and a comparison between the two.
Another useful dashboard is the partition analysis dashboard.
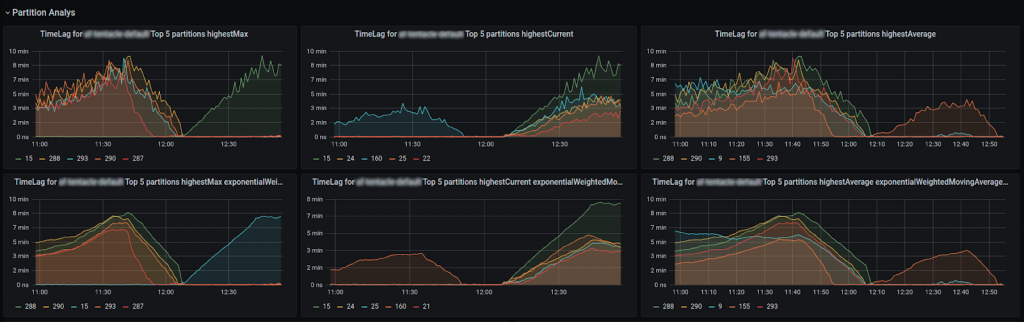
With the previous solution, we couldn’t identify exactly which partitions were lagging behind, but with this dashboard, we can identify exactly which partition has the highest lag, correlate it with the partition leader, and potentially shed some light on the incident and find a misbehaving broker.
More importantly, we were able to achieve our end game: time-based metrics.
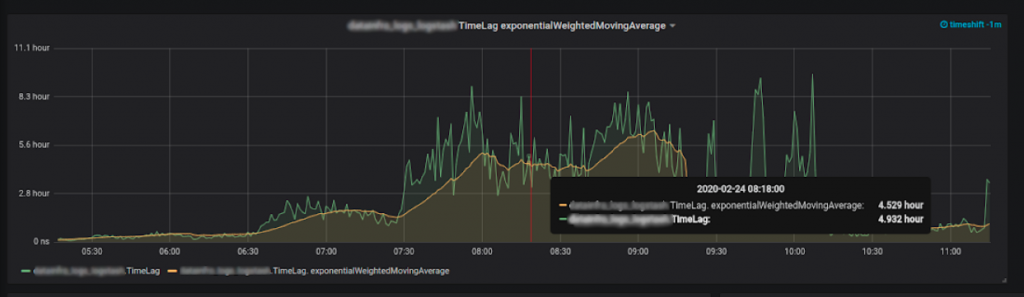
Time lag: How did we do it?
The most important metrics to collect are the last consumer message and the last produced message.
We know the lag per partition, per topic, and per consumer group. We also know the producer rate, which is our biggest assumption in the equation. We assume that the producer rate is stable—like a normal operating producer.
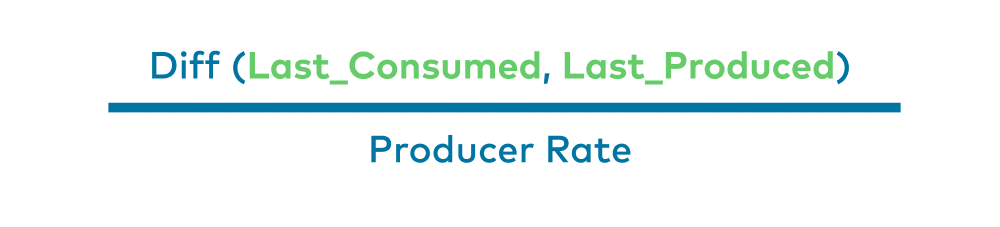
So if we will calculate the difference between the last consumed message and last produced message, and divide it by the producer rate, we will get the lag—in time units!
Here is a simple visual:
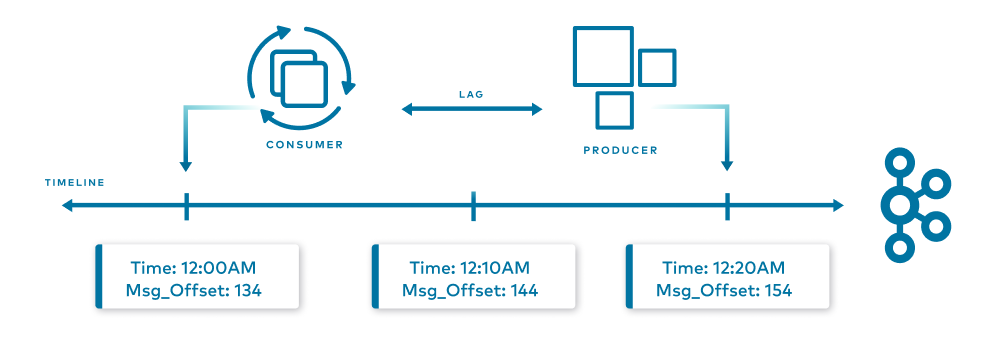
In the diagram above is a Kafka timeline. The producer produces one message a minute. At 12:00 a.m., the produced offset was 134. Ten minutes later at 12:10 a.m., the offset was 144. Ten minutes after that, it was 154, which is the current time.
While producing those messages, our consumer consumed messages at a given rate. Now, it just consumed the message that had the message offset of 134, which we already know was produced 20 minutes ago. It can then be assumed that our consumer is lagging 20 minutes behind the producer, as it just read a message that we produced 20 minutes ago. This is how we managed to get time-based lag metrics.
What’s next?
Consumer group lag is one of the crucial metrics to monitor in our system, and we addressed a major blindspot by developing actionable lag monitoring through a variety of metrics. But there’s still more to do.
Smart alerts
We want to create smarter alerts thresholds. As stated earlier, Kafka persistence is based on retention—meaning that if your lag is persistent, you will lose data at some point in time. If we have a time-based measure and the topic retention, we can trigger an alert before getting into a dangerous zone of a consumer that is not consumed fast enough and causes data loss because of the retention. To ensure this, we are using a Prometheus exporter to collect the retention (and other data as well), visualize it, and apply it in our alerting system.
Decoupling
As AppsFlyer continues to grow, and clusters load and traffic become greater, we will start decoupling “Burrow stacks” from monitoring the clusters group to monitoring a dedicated cluster. This can be performed easily because of the way that we implemented Burrow in our system. Once we split the configuration file in the dedicated Git repository and deploy, we’re good to go.
If you enjoyed reading this article and would like to learn more, you can check out my session at Kafka Summit for more details.


