New in Confluent Cloud: Making Data & Pipelines Accessible for AI-Ready Streaming | Learn More
Intrusion Detection with ksqlDB
Apache Kafka® is a distributed real-time processing platform that allows for the ingestion of huge volumes of data. ksqlDB is part of the Kafka ecosystem and offers a SQL-like language to query and process large-scale, real-time data. This blog post demonstrates how to quickly process network activity for detection intrusion using both Kafka and ksqlDB.
For testing purposes (and to avoid being banned from the enterprise network), a virtualized environment through Vagrant is used.
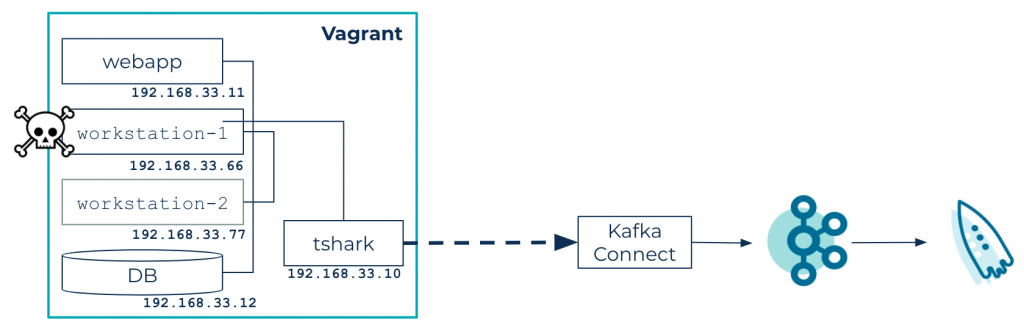
Using Vagrant, this tutorial simulates a small network with the following hosts:
- Database: a PostgreSQL database
- Web app: a toy app developed with JHipster, which performs a few calls to the database
- Workstation-1 and workstation-2: two workstations that perform calls to the web app
- TShark: a network probe that sniffs the network with the TShark tool and saves packet dumps in a shared directory in JSON format
A Kafka source connector scans the shared directory for incoming data and sends it to a Kafka cluster. ksqlDB is used to process and analyze data, producing new topics with potential intrusion alerts.
For the simulation, network packets follow the following pipeline:
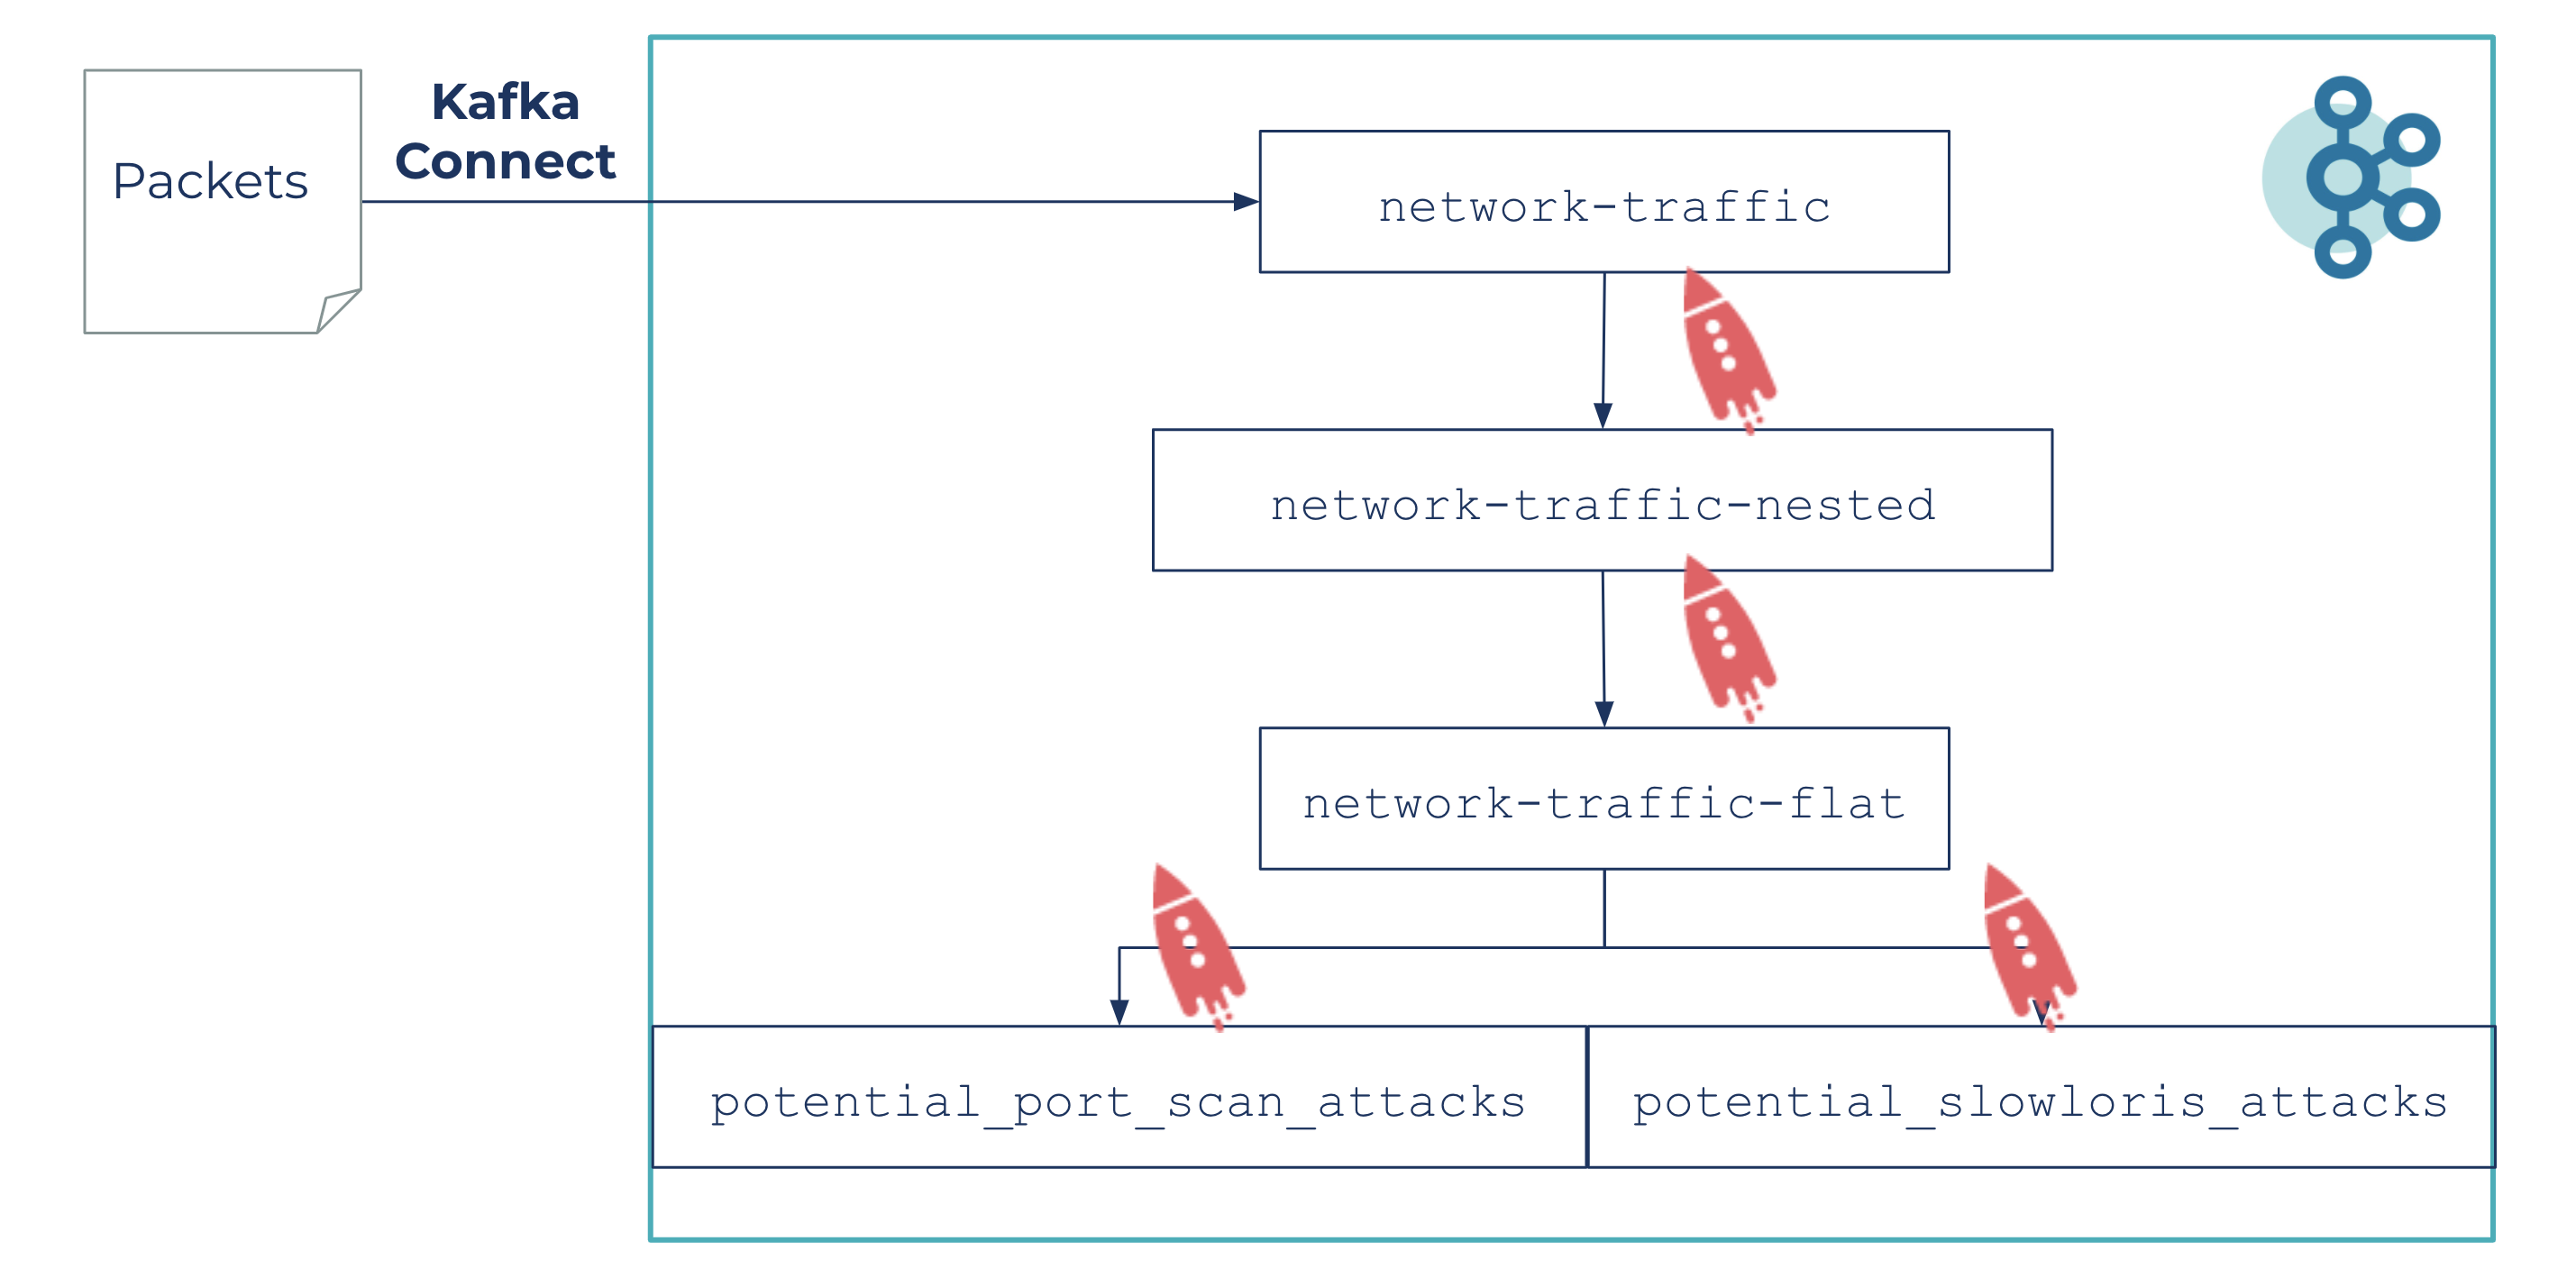
Packet files are parsed and sent to Kafka via the network-traffic topic and with the help of ksqlDB:
- Raw data is structured into a network-traffic-nested topic
- Messages are flattened and keep only required fields in the network-traffic-flat topic
- Data analysis is run from this topic to detect two kinds of potential attacks on the potential_port_scan_attacks and potential_slowloris_attacks topics
Start your engines
This blog post can be reproduced by cloning the GitHub repository. This repository helps you start a virtualized network with a few virtual machines (VM) and provides a Docker ompose stack to run Kafka and ksqlDB. Vagrant and Docker are prerequisites for running the project. Once the prerequisites are satisfied, you can start the Vagrant stack with the following:
vagrant up
After a few minutes, you can start the Kafka stack. It’s a Docker Compose file that starts Confluent Platform:
docker-compose up -d
Finally, you can proceed with data ingestion.
Data ingestion
Ingesting network packets
Network packets are captured by the TShark probe, a terminal-oriented version of Wireshark. It can produce data in JSON format, which is a simpler way for you to analyze data with ksqlDB.
An example packet data in JSON format is shown below:
{
  "timestamp": "1590682723239",
  "layers": {
	"frame": { ... },
	"eth": { ... },
	"ip": {
  	"ip_ip_version": "4",
  	"ip_ip_hdr_len": "20",
  	"ip_ip_dsfield": "0x00000000",
  	"ip_dsfield_ip_dsfield_dscp": "0",
  	"ip_dsfield_ip_dsfield_ecn": "0",
  	"ip_ip_len": "52",
  	"ip_ip_id": "0x000087f1",
  	"ip_ip_flags": "0x00004000",
  	"ip_flags_ip_flags_rb": "0",
  	"ip_flags_ip_flags_df": "1",
  	"ip_flags_ip_flags_mf": "0",
  	"ip_ip_frag_offset": "0",
  	"ip_ip_ttl": "64",
  	"ip_ip_proto": "6",
  	"ip_ip_checksum": "0x0000ef29",
  	"ip_ip_checksum_status": "2",
  	"ip_ip_src": "192.168.33.11",
  	"ip_ip_addr": [
    	"192.168.33.11",
    	"192.168.33.77"
  	],
  	"ip_ip_src_host": "192.168.33.11",
  	"ip_ip_host": [
    	"192.168.33.11",
    	"192.168.33.77"
  	],
  	"ip_ip_dst": "192.168.33.77",
  	"ip_ip_dst_host": "192.168.33.77"
	},
	"tcp": { ... }
}
You can see that such a document contains the record timestamp and information related to the OSI model: frame, ethernet, IP, and TCP, up to the application layer (SSH, HTTP, etc.).
JSON-formatted files containing packets are produced and saved to a shared filesystem between the test network and a Kafka Connect instance. This shared filesystem is provided by Vagrant, which mounts a local directory on the Vagrant VMs.
The Spool Dir connector is used for this demo and provides a source connector that scans directories for incoming files before sending them in a Kafka topic.
Below is the connector configuration:
curl -X POST \
  http://localhost:8083/connectors \
  -H 'Content-Type: application/json' \
  -d '{
    "name": "network-traffic-connector",
    "config": {
        "name": "network-traffic-connector",
        "connector.class": "com.github.jcustenborder.kafka.connect.spooldir.SpoolDirSchemaLessJsonSourceConnector",
        "tasks.max": "1",
        "input.path": "/data/logs",
        "input.file.pattern": "packets-.*",
        "error.path": "/data/error",
        "finished.path": "/data/finished",
        "halt.on.error": false,
        "topic": "network-traffic",
        "value.converter": "org.apache.kafka.connect.storage.StringConverter",
        "empty.poll.wait.ms": 100,
        "batch.size": 1000
    }
}'
You can also use the Create Network Traffic Connector request from the Postman collection.
Once the connector is started, you can check the incoming data with ksqlDB:
docker-compose exec ksql-cli ksql http://ksql-server:8088
You should see the following banner:
              	===========================================
              	=   	_          	_ ____  ____   	=
              	=  	| | _____  __ _| |  _ \| __ )  	=
              	=  	| |/ / __|/ _` | | | | |  _ \  	=
              	=  	|   <\__ \ (_| | | |_| | |_) | 	=
              	=  	|_|\_\___/\__, |_|____/|____/  	=
              	=               	|_|             =
              	=  Event Streaming Database purpose-built =
              	=    	for stream processing apps   	=
              	===========================================

Copyright 2017-2020 Confluent Inc.

CLI v5.5.0, Server v5.5.0 located at http://ksql-server:8088

Having trouble? Type 'help' (case-insensitive) for a rundown of how things work!

=ksql>
Try the following command and check that the topic network-traffic has been created:
=ksql> SHOW TOPICS;
>
 Kafka Topic 	| Partitions | Partition Replicas
---------------------------------------------------
 connect-config  | 1      	| 1
 connect-offsets | 25     	| 1
 connect-status  | 5      	| 1
 network-traffic | 3      	| 1
---------------------------------------------------
In order to read data from topics in ksqlDB, you have to create a stream as follows:
CREATE STREAM NETWORK_TRAFFIC_NESTED
(
    timestamp BIGINT,
    layers STRUCT<
   	 frame STRUCT< frame_frame_time VARCHAR, frame_frame_protocols VARCHAR >,
   	 eth STRUCT< eth_eth_src VARCHAR, eth_eth_dst VARCHAR >,
   	 ip STRUCT< ip_ip_src VARCHAR, ip_ip_src_host VARCHAR, ip_ip_dst VARCHAR, ip_ip_dst_host VARCHAR, ip_ip_flags VARCHAR, ip_ip_checksum VARCHAR, ip_ip_len VARCHAR, ip_ip_proto VARCHAR >,
   	 tcp STRUCT< tcp_tcp_stream VARCHAR, tcp_tcp_srcport VARCHAR, tcp_tcp_dstport VARCHAR, tcp_tcp_flags VARCHAR, tcp_tcp_ack VARCHAR, tcp_flags_tcp_flags_res VARCHAR, tcp_flags_tcp_flags_ns VARCHAR, tcp_flags_tcp_flags_cwr VARCHAR, tcp_flags_tcp_flags_ecn VARCHAR, tcp_flags_tcp_flags_urg VARCHAR, tcp_flags_tcp_flags_ack VARCHAR, tcp_flags_tcp_flags_push VARCHAR, tcp_flags_tcp_flags_reset VARCHAR, tcp_flags_tcp_flags_syn VARCHAR, tcp_flags_tcp_flags_fin VARCHAR, tcp_flags_tcp_flags_str VARCHAR >,
   	 http STRUCT<
   		 http_http_host VARCHAR,
   		 http_http_request_full_uri VARCHAR,
   		 text_http_request_method VARCHAR,
   		 text_http_request_version VARCHAR,
   		 http_http_authorization VARCHAR,
   		 http_http_user_agent VARCHAR,
   		 text_http_response_version VARCHAR,
   		 text_http_response_code VARCHAR,
   		 text_http_response_phrase VARCHAR,
   		 http_http_content_type VARCHAR,
   		 http_http_response_line array,
   		 http_http_response_for_uri VARCHAR,
   		 http_http_file_data VARCHAR
   	 >
    >
)
WITH (KAFKA_TOPIC='network-traffic', TIMESTAMP='timestamp', VALUE_FORMAT='JSON');

 Message
----------------
 Stream created
----------------
=ksql> SELECT layers->ip->ip_ip_src_host FROM network_traffic_nested EMIT CHANGES LIMIT 10;
+----------------------------------------+
|LAYERS__IP__IP_IP_SRC_HOST          	|
+----------------------------------------+
|192.168.33.11                       	|
|192.168.33.11                       	|
|192.168.33.77                       	|
|192.168.33.11                       	|
|192.168.33.12                       	|
|192.168.33.11                       	|
|192.168.33.77                       	|
|192.168.33.11                       	|
|192.168.33.11                       	|
|192.168.33.77                       	|
Limit Reached
Query terminated
As you can see, the JSON tree can be deep; therefore, to ease data manipulation, you need to simplify your data, which is done with ksqlDB, of course!
Structuring JSON
The first step is JSON flattening, and ksqlDB allows you to access nested fields with the -> operator. The structure can be deeply nested, so it’s not very user friendly for exploring the data. Thus, you need to flatten the JSON with a query. Also, you only need to focus on certain kinds of fields, so start with a query that flattens and selects only the required fields. Use the CREATE STREAM … AS SELECT statement for this operation:
CREATE STREAM NETWORK_TRAFFIC_FLAT
AS SELECT
timestamp,
layers->frame->frame_frame_protocols as frame_protocols,
layers->frame->frame_frame_time as frame_time,
layers->eth->eth_eth_src as eth_addr_source,
layers->eth->eth_eth_dst as eth_addr_dest,
layers->ip->ip_ip_src as ip_source,
layers->ip->ip_ip_src_host as host_source,
layers->ip->ip_ip_dst as ip_dest,
layers->ip->ip_ip_dst_host as host_dest,
layers->ip->ip_ip_flags as ip_flags,
layers->ip->ip_ip_checksum as ip_checksum,
layers->ip->ip_ip_len as ip_length,
layers->ip->ip_ip_proto as ip_protocol,

layers->tcp->tcp_tcp_stream as tcp_stream,
layers->tcp->tcp_tcp_srcport as tcp_port_source,
layers->tcp->tcp_tcp_dstport as tcp_port_dest,
layers->tcp->tcp_tcp_flags as tcp_flags,
layers->tcp->tcp_tcp_ack as tcp_ack,
layers->tcp->tcp_flags_tcp_flags_res as tcp_flags_res,
layers->tcp->tcp_flags_tcp_flags_ns as tcp_flags_ns,
layers->tcp->tcp_flags_tcp_flags_cwr as tcp_flags_cwr,
layers->tcp->tcp_flags_tcp_flags_ecn as tcp_flags_ecn,
layers->tcp->tcp_flags_tcp_flags_urg as tcp_flags_urg,
layers->tcp->tcp_flags_tcp_flags_ack as tcp_flags_ack,
layers->tcp->tcp_flags_tcp_flags_push as tcp_flags_push,
layers->tcp->tcp_flags_tcp_flags_reset as tcp_flags_reset,
layers->tcp->tcp_flags_tcp_flags_syn as tcp_flags_syn,
layers->tcp->tcp_flags_tcp_flags_fin as tcp_flags_fin,
layers->tcp->tcp_flags_tcp_flags_str as tcp_flags_str,

layers->http->http_http_host as http_host,
layers->http->http_http_request_full_uri as http_request_full_uri,
layers->http->text_http_request_method as http_request_method,
layers->http->text_http_request_version as http_request_version,
layers->http->http_http_authorization as http_authorization,
layers->http->http_http_user_agent as http_user_agent,

layers->http->text_http_response_version as http_response_version,
layers->http->text_http_response_code as http_response_code,
layers->http->text_http_response_phrase as http_response_phrase,
layers->http->http_http_content_type as http_content_type,
layers->http->http_http_response_for_uri as http_response_for_uri,
layers->http->http_http_file_data as http_file_data
FROM NETWORK_TRAFFIC_NESTED;
>
Message
--------------------------------------------------------------------------------------------------------------
Stream NETWORK_TRAFFIC_FLAT created and running. Created by query with query ID: CSAS_NETWORK_TRAFFIC_FLAT_1
--------------------------------------------------------------------------------------------------------------
The CREATE STREAM AS SELECT statement creates a materialized view in a topic (here, it is NETWORK_TRAFFIC_FLAT) and streams SELECT query results into this topic.
Your first query
It’s now easier to query your network traffic data. For example, you can see the source and destination IPs of packets with the following query:
=ksql> SELECT ip_source, ip_dest FROM network_traffic_flat EMIT CHANGES LIMIT 10;

+------------------+-------------------+
|IP_SOURCE     	|IP_DEST        	|
+------------------+-------------------+
|192.168.33.11 	|192.168.33.77  	|
|192.168.33.77 	|192.168.33.11  	|
|192.168.33.11 	|192.168.33.12  	|
|192.168.33.11 	|192.168.33.12  	|
|192.168.33.12 	|192.168.33.11  	|
|192.168.33.11 	|192.168.33.77  	|
|192.168.33.77 	|192.168.33.11  	|
|192.168.33.11 	|192.168.33.12  	|
|192.168.33.11 	|192.168.33.12  	|
|192.168.33.12 	|192.168.33.11  	|
Limit Reached
Query terminated
A word about aggregations, streams, and tables
A duality: stream versus table. Streams represent a flow of events. Tables are the changelog, a materialized view of this aggregated flow of events. In Kafka, events are written in a topic, then consumers receive new events as soon as they come on to a subscribed topic. Those events can be aggregated to materialize a view of the events (an account balance, a product stock availability, a count of network connections between two hosts, etc.).
The stream versus table duality is represented in the following diagram:
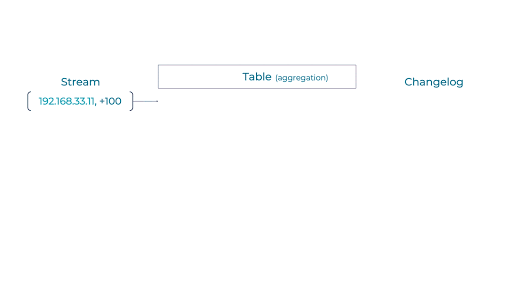
This diagram shows how counting connections by IP address works: Each new event in the stream is processed, and counters for that key are updated (here, it is a sum). When a key is updated, a new event is generated: It represents the most recent state (the total sum) for a given key.
There are situations where it is not very insightful to aggregate data from the beginning of time, and it’s more interesting to aggregate values on a fixed period ( sales over the last month/quarter/year, clickstreams over the last 15 minutes, IP connections over the last five seconds, etc.). This is where time windows come into play. With windowing, you are able to split your event timeline into smaller buckets and perform aggregations bucket by bucket. Below is an example of a hopping time window of five seconds:
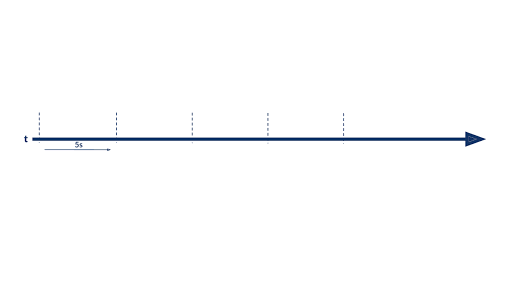
There are three available kinds of windows in ksqlDB:
- TUMBLING (the one described above)
- HOPPING (similar to a hopping window with an advance interval different from the window size)
- SESSION (to group records separated by a specified gap of inactivity)
Packets analysis
The following goes further into network analysis by demonstrating how to detect a port mapping and a Slowloris attack.
Detection of port mapping
Port mapping consists of detecting all available hosts on a network, and for each host, a list of open ports. Once the ports are detected (i.e., port 80 for HTTP and port 22 for SSH), tools can be used to detect the OS version, hardware configurations, or potential security problems. A classic tool for performing port mapping is Nmap.
You can try to detect such behaviours by counting packets between hosts and by triggering an alert when there are lots of packets between two hosts on several different ports. Below is a sample query to detect this kind of attack:
CREATE TABLE potential_port_scan_attacks
AS SELECT
   ip_source,
COUNT_DISTINCT(ip_dest + tcp_port_dest)
FROM NETWORK_TRAFFIC_FLAT
WINDOW TUMBLING (SIZE 60 SECONDS)
GROUP BY ip_source
HAVING COUNT_DISTINCT(ip_dest + tcp_port_dest) > 1000;
Here, you use the COUNT_DISTINCT function to count <ip, port> tuple occurrences. If this count is greater than 1,000 for a given IP, it means that this IP is establishing more than 1,000 connections over the network on distinct machines and ports, which should be considered suspicious.
Next, you can simulate a port mapping with Nmap:
$ cd infra
$ vagrant ssh compromised
vagrant@intruder:~$ nmap -n -sT -sV -sC 192.168.33.0/24

Starting Nmap 7.60 ( https://nmap.org ) at 2020-06-12 14:54 UTC
Looking back to the ksqlDB console, the following results should appear:
+---------------+---------------+---------------+---------------+---------------+------------+
| ROWTIME   	| ROWKEY    	| WINDOWSTART   | WINDOWEND 	| IP_SOURCE 	| KSQL_COL_1 |
+---------------+---------------+---------------+---------------+---------------+------------+
| 1591973670872 | 192.168.33.66 | 1591973640000 | 1591973700000 | 192.168.33.66 | 1272   	|
| 1591973670926 | 192.168.33.66 | 1591973640000 | 1591973700000 | 192.168.33.66 | 1961   	|
| 1591973670986 | 192.168.33.66 | 1591973640000 | 1591973700000 | 192.168.33.66 | 2502   	|
| 1591973671056 | 192.168.33.66 | 1591973640000 | 1591973700000 | 192.168.33.66 | 3262   	|
| 1591973671125 | 192.168.33.66 | 1591973640000 | 1591973700000 | 192.168.33.66 | 3993   	|
| 1591973671200 | 192.168.33.66 | 1591973640000 | 1591973700000 | 192.168.33.66 | 4827   	|
| 1591973677539 | 192.168.33.66 | 1591973640000 | 1591973700000 | 192.168.33.66 | 4909   	|
You can see that 192.168.33.66 is detected as a suspicious host.
Detection of Slowloris attacks
Another well-known attack is the Slowloris DDoS attack. Its goal is to shut down your activity by creating and maintaining lots of HTTP connections. To perform a DDoS attack, small HTTP connections are initiated by the malicious script; this requires low effort on the attacker side, but it can bring your server down. When the server has no more connections available, it will drop new connections and send a RESET flag in the TCP packet. You can see if there is a peak of RESET packets sent by a server to a specific destination by analyzing the tcp_flags_reset flag.
Below is a sample query to detect a Slowloris attack:
CREATE TABLE potential_slowloris_attacks
AS SELECT
    ip_source,
    count(*) as count_connection_reset
FROM NETWORK_TRAFFIC_FLAT
WINDOW TUMBLING (SIZE 60 SECONDS)
WHERE tcp_flags_ack = '1' AND tcp_flags_reset = '1'
GROUP BY ip_source
HAVING count(*) > 100;
=ksql> SELECT * FROM potential_slowloris_attacks EMIT CHANGES;
+---------------+---------------+---------------+---------------+---------------+------------------------+
| ROWTIME   	| ROWKEY    	| WINDOWSTART   | WINDOWEND 	| IP_SOURCE 	| COUNT_CONNECTION_RESET |
+---------------+---------------+---------------+---------------+---------------+------------------------+
Press CTRL-C to interrupt
Here, you split the timeline into one-minute windows and count the number of packets that are flagged with ACK and RESET. If this count is above a given threshold, a new record is created in the potential_slowloris_attacks topic.
Then you can simulate a Slowloris attack by logging on to the compromised VM and starting the slowhttp test command:
$ cd infra
$ vagrant ssh compromised
vagrant@intruder:~$ slowhttptest -c 10000 -H -g -o slowhttp -i 10 -r 500 -t GET -u http://web.local:8080 -x 24 -p 3
Fri Jun  5 08:44:01 2020:
    	slowhttptest version 1.6
 - https://code.google.com/p/slowhttptest/ -
test type:                    	SLOW HEADERS
number of connections:        	10000
URL:                          	http://web.local:8080/
verb:                         	GET
Content-Length header value:  	4096
follow up data max size:      	52
interval between follow up data:  10 seconds
connections per seconds:      	500
probe connection timeout:     	3 seconds
test duration:                	240 seconds
using proxy:                  	no proxy

Fri Jun  5 08:44:01 2020:
slow HTTP test status on 20th second:

initializing:    	0
pending:         	1
connected:       	4063
error:           	0
closed:          	424
service available:   NO
Back to the ksqlDB console, these results quickly appear:
+---------------+---------------+---------------+---------------+---------------+------------------------+
| ROWTIME   	| ROWKEY    	| WINDOWSTART   | WINDOWEND 	| IP_SOURCE 	| COUNT_CONNECTION_RESET |
+---------------+---------------+---------------+---------------+---------------+------------------------+
| 1591890288225 | 192.168.33.66 | 1591890240000 | 1591890300000 | 192.168.33.66 | 271                	|
| 1591890291028 | 192.168.33.66 | 1591890240000 | 1591890300000 | 192.168.33.66 | 807                	|
| 1591890296634 | 192.168.33.66 | 1591890240000 | 1591890300000 | 192.168.33.66 | 1922               	|
| 1591890298235 | 192.168.33.66 | 1591890240000 | 1591890300000 | 192.168.33.66 | 2363               	|
| 1591890299999 | 192.168.33.66 | 1591890240000 | 1591890300000 | 192.168.33.66 | 2711               	|
| 1591890301114 | 192.168.33.66 | 1591890300000 | 1591890360000 | 192.168.33.66 | 243                	|
| 1591890305576 | 192.168.33.66 | 1591890300000 | 1591890360000 | 192.168.33.66 | 1242               	|
| 1591890308236 | 192.168.33.66 | 1591890300000 | 1591890360000 | 192.168.33.66 | 1823               	|
Going further with JOINs and UDFs
You have seen simple examples that can be used as an initial tool to perform basic intrusion detection. Those examples could be greatly improved by using two great ksqlDB features: JOIN and the user-defined function (UDF).
Enrich data with JOINs
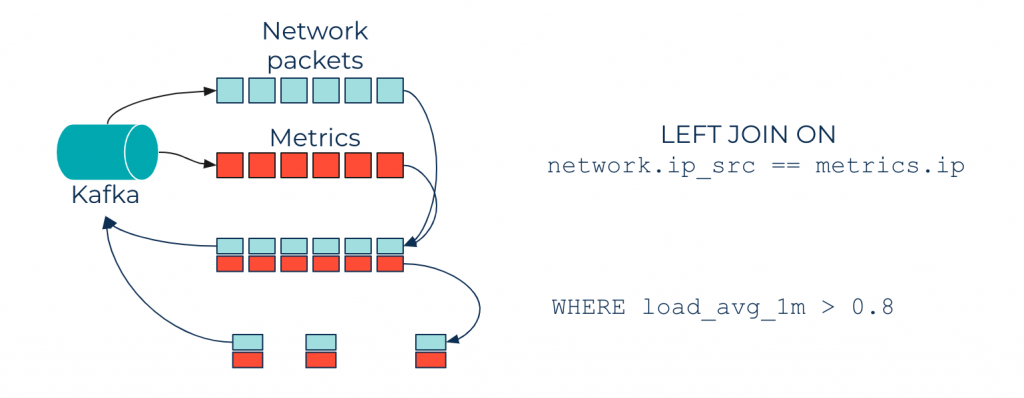
The queries above were performed on a single topic as input, but ksqlDB can do more—you can perform JOIN queries to enrich the network_traffic_flat topic with metrics.
For example, say you have a topic containing metrics (collected with tools like Metricbeat, Fluent Bit, etc.) of all your nodes. Data from network packets can be enriched with metric data by joining on the node IP. Thus, you can improve your ksqlDB queries by adding filters on enriched data, and throw alerts when the CPU load goes beyond a threshold, as shown in the diagram below:
Enrich language
Another useful feature in ksqlDB is the UDF, which can be used to extend ksqlDB features.
Imagine you have trained a machine learning (ML) model to detect if a network packet is suspicious. You can implement a UDF that applies this model to each incoming record, giving a statement like the following:
SELECT predict(ip_source, ip_dest, other_interesting_columns)
FROM network_traffic
Learn more
This blog post features a sample use case using ksqlDB for intrusion detection, going from simple queries for filtering data to aggregation queries on time windows. Intrusion detection is a very broad topic and ksqlDB has many more features that can be used to perform real-time analysis on flows of network data, such as aggregation, JOINs, UDFs, and much more.
To dig deeper into the ksqlDB, check out the sample project on GitHub.
Ready to check ksqlDB out? Head over to ksqldb.io to get started, where you can follow the quick start, read the docs, and learn more!
Did you like this blog post? Share it now
Subscribe to the Confluent blog


Why ELT Can't Keep Up in the Era of High-Scale Data Engineering
Batch ELT pipelines create duplication, cost spikes, and governance gaps as data scales. Here’s why enterprises are rethinking legacy integration models.


How to Protect PII in Apache Kafka® With Schema Registry and Data Contracts
Protect sensitive data with Data Contracts using Confluent Schema Registry.