Neu in Confluent Cloud: Daten & Pipelines für KI-fähiges Streaming zugänglich machen | Mehr erfahren
How streaming data and a lakehouse paradigm can help manage risk in volatile trading markets
As we are witnessing, global capital markets are subject to a number of different forces that can impact market and portfolio volatility and risk. For financial services firms, the challenge is to meet regulators’ demands, manage capital wisely, and communicate with customers clearly. They have to consolidate data from a variety of applications and services to be able to answer questions from the business—and traditional data platforms don’t provide the necessary volume, velocity, or analytics capabilities.
For capital markets and trading operations businesses in particular, managing risk well is the key to success. Firms have had to learn to work with streaming data pipelines to get instant answers, and treat databases as systems of record, using them for historical data analysis.
With integrated technology from Confluent and Databricks, risk managers and trading firms can gain a real-time understanding of their current risk in order to inform their trading strategies. At the recent Data + AI Summit, attendees explored this demo on using data streaming to quickly and securely process and extract value from data.
The demo walks through how Confluent’s streaming data technology can enrich portfolio and market data in real time and feed it directly into mathematical models and simulations performed within Databricks’ Lakehouse, based on the work in this solution. The result is that key risk metrics can be available in near real-time at a trader’s fingertips whenever needed.
It’s a simple approach that uses Confluent and Databricks to ingest and process large amounts of raw data to compute real-time portfolio valuations, risk metrics such as options Greeks, value at risk, and the global minimum volatility portfolio (GMV).
Why Capital Markets and Trading Operations Firms Need to Innovate
Capital markets have seen significant reforms in the last decade with robust risk management, closer supervision, new asset classes, and technical transformation. The regulatory environment has become more complex, some regulations have come and gone, and reporting has become more rigorous and frequent.
The decision-making agility that firms now require dictates that they have a very broad range of information sources readily available to them, from relatively static reference data and internal sources to streaming feeds from market data providers and exchanges. The complexities of every environment include both cloud and on-prem applications, third-party services, remote operations data aggregation, geographic distribution, and cryptocurrency exchange requirements, among others.
Something as simple as an individual trader maintaining an accurate positions table requires every trade to be loaded and the positions calculated and updated in real time. While this sounds simple enough, consider a firm with thousands of trading staff, thousands of instruments, thousands of portfolios, millions of positions, and millions of trades, that trades in 30+ cities in multiple time zones using multiple currencies.
Tackling this type of modern complexity involves a few key components:
- Real-time streams of enriched data
A data streaming platform like Confluent’s breaks down this complexity by enabling aggregations to be created rapidly at a level of detail appropriate to the task, at the appropriate level of the hierarchy. Streaming data keeps these aggregations continuously up to date, and the people who need to be informed have the correct information readily available.Trading teams take this aggregated information and enrich it with other sources of information to conduct a multitude of tasks. Tasks vary, but include:- Portfolio valuation
- Calculating exposures relative to limits
- Comparing critical ratios like hit and fill ratios across venues
- Monitoring roundtrip times
- Optimizing collateral
- Managing margins
- Following risk team guidelines in a risk-appetite framework
- Risk metrics
Risk teams need this aggregated information to calculate a number of different risk metrics including market risk, counterparty credit risk, credit value adjustment (CVA), debit value adjustment (DVA), liquidity risk, model risk, conditional value at risk (CVaR), and the calculation and maintenance of sensitivities (P&L Vectors).These measures represent significant complexity, and demand accuracy in data throughout the risk process. Streaming data keeps these aggregations continuously up to date. To allow risk teams to continuously measure risk at the appropriate level of the hierarchy, each level has to be calculated separately, as many of the risk measures used are non-additive.The stream of data enables a team to build a firm-wide view of risk. At the time of the global crisis in 2008, this calculation was done daily, and leaders often had to wait a full day to understand their exposures. Having the information on hand in near real time represents huge progress. - Modeling risk with a Lakehouse
End-to-end real-time capabilities across Databricks and Confluent make it possible to feed the incremental mathematical models used to create the above-mentioned risk metrics. By connecting this stream of data managed by Confluent to Databricks’ Lakehouse, this real-time data can be used as input for Monte Carlo simulations and other calculations that result in the key risk metrics discussed. Because the data is flowing in real time, Delta Live Tables is used to consume data incrementally so that valuations can be updated and risk measures can be summarized with newest data.
Confluent and Databricks Architecture
Building the Foundation for Real-Time Risk Management
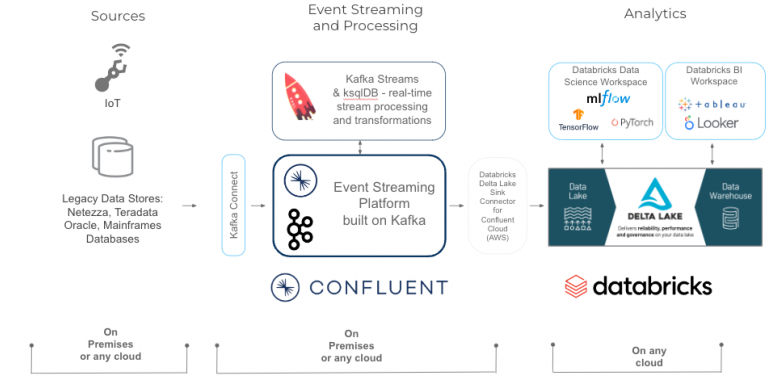
Firms have a multitude of inbound and outbound data sources that must be captured and transformed, ready to populate the systems that the business uses to make decisions. To create an architecture to effectively, securely manage constant streams of data and make better decisions based on market conditions, we chose a few essential components.
Unified storage
Databricks Delta Lake is an open format storage layer that delivers reliability, security, and performance on your data lake—for both streaming and batch operations. By replacing data silos with a single home for structured, semi-structured, and unstructured data, Delta Lake is the foundation of a cost-effective, highly scalable lakehouse.
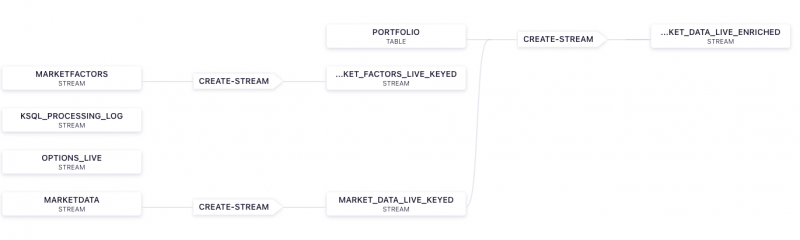
Market Data Flow in Confluent
Risk Calculations with Delta Live Tables

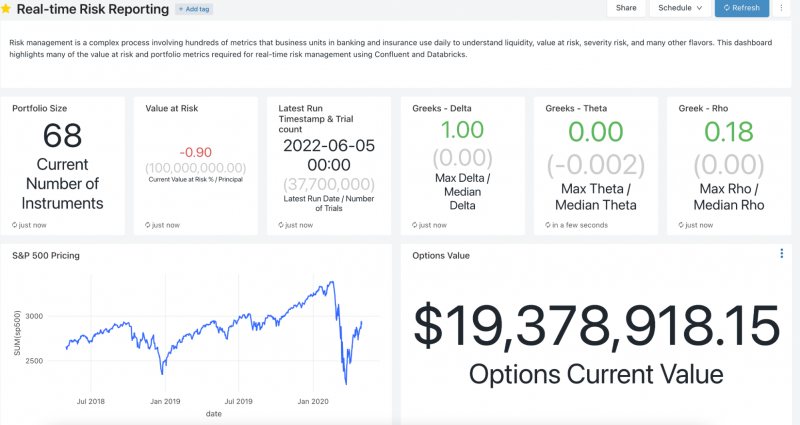
Risk visualizations
By enriching the portfolio and market data in real-time within Confluent and feeding this data into the risk and volatility calculations performed within Delta Lake, dashboards can be created using Databricks SQL to give traders a real-time view into their key risk and volatility calculations.
Visualization of Risk Metrics
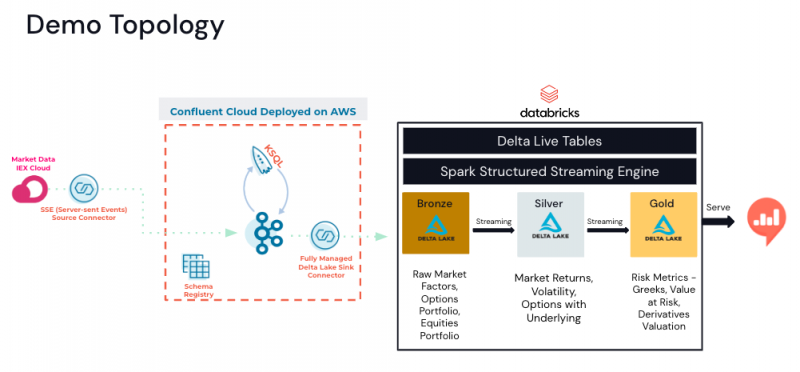
Risk Management Demo Architecture
The market price and market factors data is provided by the IEX Cloud API using a SSE (Server-sent Events) Source Connector to write the financial data to Kafka topics. Confluent ksqlDB queries will apply a schema to the data and enrich the real-time streaming data by joining it with a market portfolio contained in a ksqlDB table. Options contract details associated with the portfolio are maintained on a separate topic. The streaming data will be written to Delta Lake tables using the Databricks Delta Lake Sink Connector for Confluent Cloud. The Databricks Delta Lake Sink connector supports exactly once semantics by consuming topic data from Confluent Cloud and writing these records to Databricks Delta Lake tables. For more information on the Databricks Delta Lake Sink connector, check out this online webinar and this blog.
With the data in the Delta Lake tables, Delta Live Tables will run real-time transformation to obtain rolling 90 days of market factors. Monte Carlo simulations will provide samples from returns. Value at risk will be calculated using all Monte Carlo trials for real-time risk and real-time Greeks calculation with a dashboard to visually present the results.
Getting started with Confluent Cloud and Databricks
We’ve seen with our customers that these firms need to capture and transform a multitude of inbound and outbound data sources to populate systems and make better decisions. Confluent has become the central nervous system of trading operations data for many of the world’s largest brokerage firms, hedge funds, asset managers, and exchanges.
To get started, check out the Databricks Connector for Confluent Cloud documentation and take it for a spin on Databricks for free with a 14-day trial.
Ist dieser Blog-Beitrag interessant? Jetzt teilen
Confluent-Blog abonnieren


From 1 to 1 Million: How Agent Taskflow Built a Scalable AI Future with AWS and Confluent
Agent Taskflow built a multi‑agent AI platform on Confluent Cloud and AWS that can scale from one to one million agents with sub‑30ms latency. This post breaks down their architecture, benchmark results, and why an event‑driven backbone is critical for production agentic AI.


Scaling the Streaming Stack: Introducing the Sell with Confluent Partner Program
Sell with Confluent is our new reseller engagement model, designed to empower partners with streamlined quoting, automated incentives, and scalable growth.