Troubleshooting KSQL – Part 2: What’s Happening Under the Covers?
Previously in part 1, we saw how to troubleshoot one of the most common issues that people have with KSQL—queries that don’t return data even though data is expected. Here, we’ll dig deeper into the internals for more advanced troubleshooting and better understand how it all works.
You can use this article for reference, or follow along with the code examples to try them out as we go. Using Docker and Docker Compose, we can easily provision an environment in which to explore and try out the different techniques and tools. The environment includes a data generator for a continuous stream of events into an Apache Kafka® topic that we will use for testing. All the necessary code is available on GitHub.
Let’s dive in and start exploring what to do when things aren’t working…
How many messages have been processed by a KSQL query?
In KSQL you can populate Kafka topics with the results of a query using the CREATE STREAM…AS SELECT syntax:
ksql> CREATE STREAM GOOD_IOS_RATINGS AS \
        SELECT * FROM RATINGS WHERE STARS >= 4 \
                               AND CHANNEL='iOS';
Because KSQL queries are continuous, this means that we’ve just written and executed an application. It takes the inbound data, filters it for a condition and writes any matches to the target topic.
What does any self-respecting application need? Metrics! We need to know how many messages have been processed, when the last message was processed and so on.
The simplest option for gathering these metrics comes from within KSQL itself, using the same DESCRIBE EXTENDED command that we saw before:
ksql> DESCRIBE EXTENDED GOOD_RATINGS;
[...]
Local runtime statistics
------------------------
messages-per-sec:      1.10 total-messages:     2898 last-message: 9/17/18 1:48:47 PM UTC
 failed-messages:         0 failed-messages-per-sec:         0 last-failed: n/a
(Statistics of the local KSQL server interaction with the Kafka topic GOOD_RATINGS)
ksql>
Also note that an increasing failed-messages count is not a good sign for the health of your query. It could be caused by serialization errors, as discussed in part 1. The metrics shown here are local to the server on which the DESCRIBE statement executes. The documentation includes definitions of all the metrics.
What’s happening under the covers?
To dig deeper into the execution of queries, let’s start by listing the queries that are running:
ksql> SHOW QUERIES;Query ID | Kafka Topic | Query String
CSAS_GOOD_IOS_RATINGS_0 | GOOD_IOS_RATINGS | CREATE STREAM GOOD_IOS_RATINGS AS SELECT * FROM RATINGS WHERE STARS >= 4 AND CHANNEL='iOS'; --------------------------------------------------------------------------------------------------------------------------------------------------------------------------
Just the one query is running, populating GOOD_IOS_RATINGS, as defined in the CSAS statement we ran above. The query is called CSAS_GOOD_IOS_RATINGS_0 (which is non-deterministic).
We can examine the query itself and how KSQL is going to perform the transformation we’ve asked it to through the explain plan—the same thing as you get in a RDBMS. You can access it by using the EXPLAIN command:
ksql> EXPLAIN CSAS_GOOD_IOS_RATINGS_0;[...]
Execution plan
> [ SINK ] Schema: [ROWTIME : BIGINT, ROWKEY : VARCHAR, RATING_ID : BIGINT, USER_ID : BIGINT, STARS : INT, ROUTE_ID : BIGINT, RATING_TIME : BIGINT, CHANNEL : VARCHAR, MESSAGE : VARCHAR]. > [ PROJECT ] Schema: [ROWTIME : BIGINT, ROWKEY : VARCHAR, RATING_ID : BIGINT, USER_ID : BIGINT, STARS : INT, ROUTE_ID : BIGINT, RATING_TIME : BIGINT, CHANNEL : VARCHAR, MESSAGE : VARCHAR]. > [ FILTER ] Schema: [RATINGS.ROWTIME : BIGINT, RATINGS.ROWKEY : VARCHAR, RATINGS.RATING_ID : BIGINT, RATINGS.USER_ID : BIGINT, RATINGS.STARS : INT, RATINGS.ROUTE_ID : BIGINT, RATINGS.RATING_TIME : BIGINT, RATINGS.CHANNEL : VARCHAR, RATINGS.MESSAGE : VARCHAR]. > [ SOURCE ] Schema: [RATINGS.ROWTIME : BIGINT, RATINGS.ROWKEY : VARCHAR, RATINGS.RATING_ID : BIGINT, RATINGS.USER_ID : BIGINT, RATINGS.STARS : INT, RATINGS.ROUTE_ID : BIGINT, RATINGS.RATING_TIME : BIGINT, RATINGS.CHANNEL : VARCHAR, RATINGS.MESSAGE : VARCHAR].
Because KSQL is built on Kafka Streams and executes queries using it, the EXPLAIN command can also tell you the topology that Kafka Streams will use:
<ksql> EXPLAIN CSAS_GOOD_IOS_RATINGS_0;[...]
Processing topology
Topologies: Sub-topology: 0 Source: KSTREAM-SOURCE-0000000000 (topics: [ratings]) --> KSTREAM-MAPVALUES-0000000001 Processor: KSTREAM-MAPVALUES-0000000001 (stores: []) --> KSTREAM-TRANSFORMVALUES-0000000002 <-- KSTREAM-SOURCE-0000000000 Processor: KSTREAM-TRANSFORMVALUES-0000000002 (stores: []) --> KSTREAM-FILTER-0000000003 <-- KSTREAM-MAPVALUES-0000000001 Processor: KSTREAM-FILTER-0000000003 (stores: []) --> KSTREAM-MAPVALUES-0000000004 <-- KSTREAM-TRANSFORMVALUES-0000000002 Processor: KSTREAM-MAPVALUES-0000000004 (stores: []) --> KSTREAM-MAPVALUES-0000000005 <-- KSTREAM-FILTER-0000000003 Processor: KSTREAM-MAPVALUES-0000000005 (stores: []) --> KSTREAM-SINK-0000000006 <-- KSTREAM-MAPVALUES-0000000004 Sink: KSTREAM-SINK-0000000006 (topic: GOOD_IOS_RATINGS) <-- KSTREAM-MAPVALUES-0000000005
Taking the query name, you can even go and poke around the KSQL server log, and see the Kafka Streams applications firing up with the query name as part of their client ID:
ksql-server_1 | [2018-09-19 21:05:40,625] INFO stream-thread [_confluent-ksql-confluent_rmoff_01query_CSAS_GOOD_IOS_RATINGS_0-c36ebad2-f969-40e1-9b59-757305cf3b61-StreamThread-5] State transition from CREATED to RUNNING (org.apache.kafka.streams.processor.internals.StreamThread:209)
The KSQL server log is where you’d head to if you’re suspecting problems with your queries that you can’t diagnose through the KSQL CLI itself. To locate the server log, see here.
Digging deeper: KSQL troubleshooting with Confluent Control Center
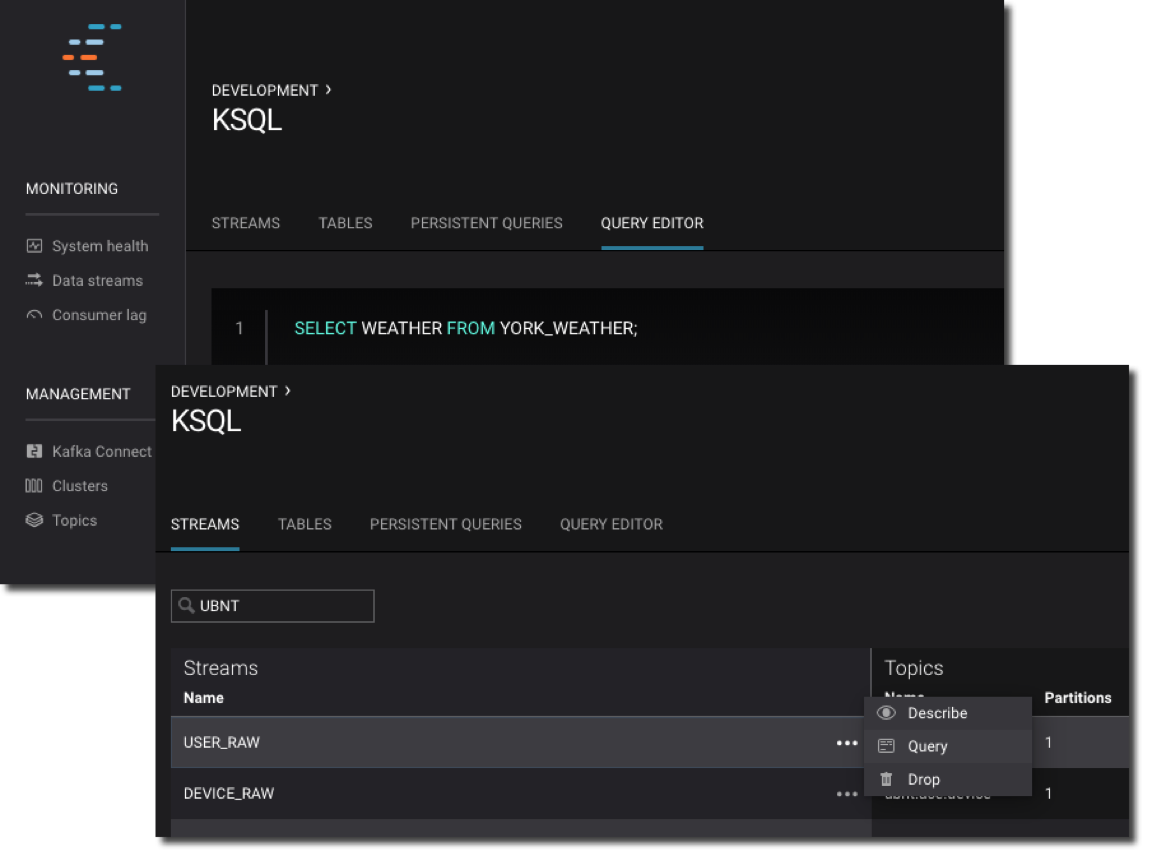
Part of Confluent Platform, Confluent Control Center gives you powerful monitoring, management and alerting capabilities for your Apache Kafka environment. It provides a KSQL editor for building and exploring KSQL objects:
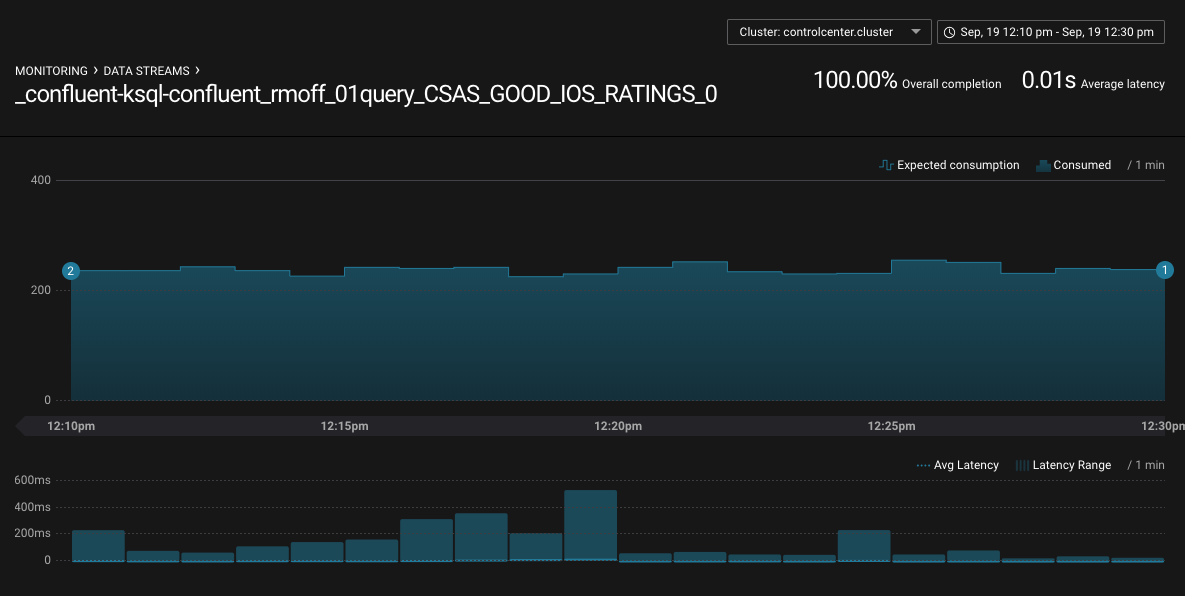
It also has a powerful streams monitoring capability.
With streams monitoring, you can answer these important questions:
- What’s the message throughput rate of the pipeline?
- Were all messages that were written to Kafka consumed by the downstream application, including KSQL?
- Were any messages consumed more than once?
- What was the latency of each consumer?
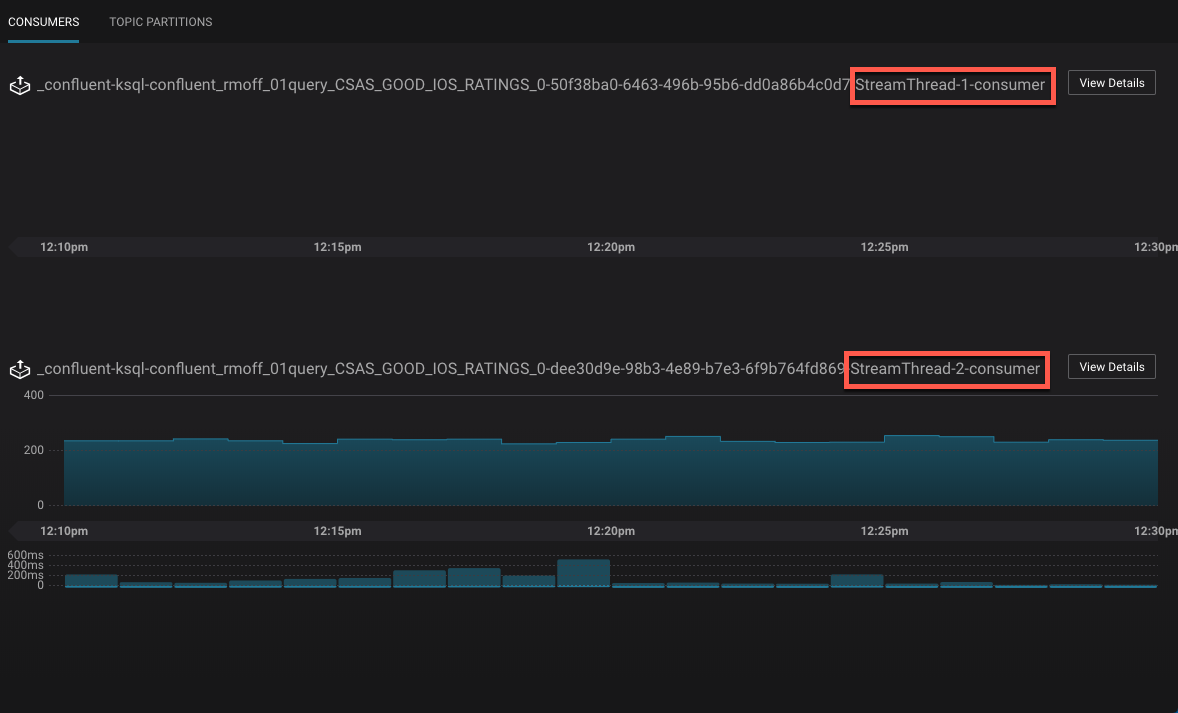
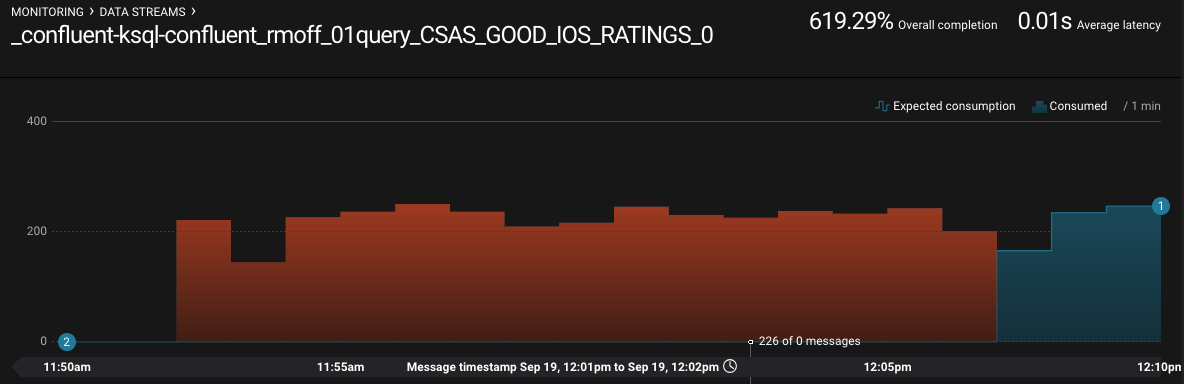
You can drill down into individual topics and consumers to inspect their particular behavior. Here, we can see that there are two Kafka Streams threads, only one of which (StreamThread-2) is consuming data. The reason for that is the source topic has a single partition:
If we re-partition the topic to four partitions, the Kafka Streams/KSQL task then consumes this over four threads: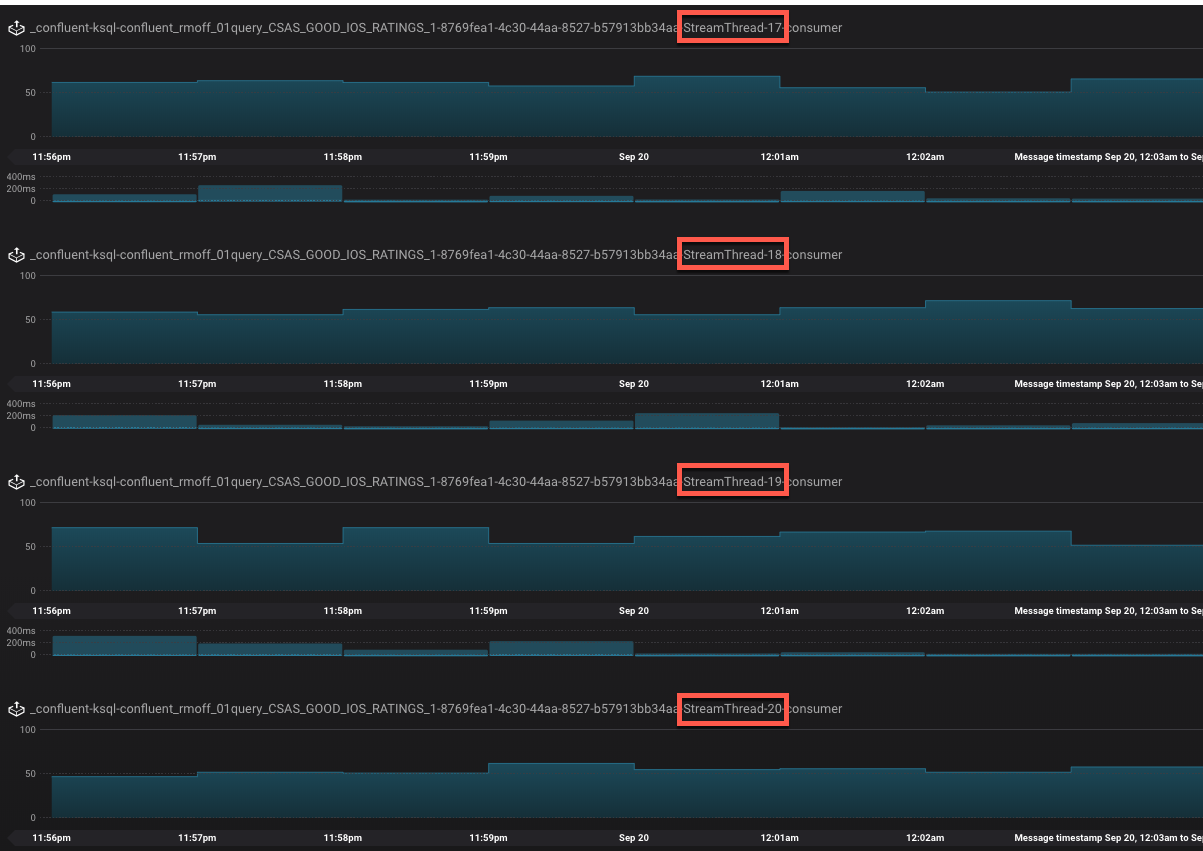
Confluent Control Center can also show you when consumers are over-consuming, which can occur when messages are being processed more than once—or as the case is in this screenshot, the required monitoring interceptors haven’t been set up on the producer.
Digging deeper: KSQL troubleshooting with JMX
Confluent Control Center is very cool for inspecting the flow of data in topics and behavior of producers and consumers, but what if we peeked inside how those producers and consumers are actually behaving? KSQL, as with other components in the Apache Kafka ecosystem, exposes a wealth of metrics through JMX. You can access these on an ad hoc basis through something like jmxterm or JConsole, as seen here:
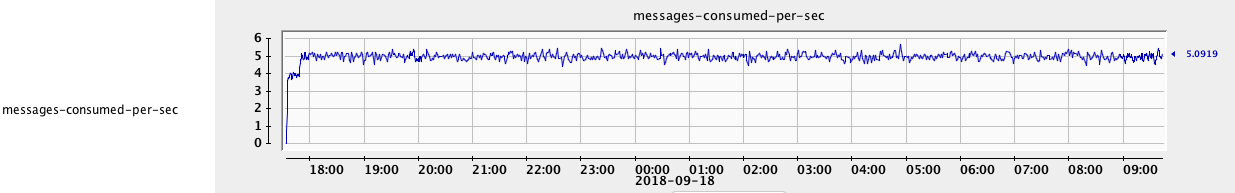
Even more useful is persisting them to a data store, such as InfluxDB, for subsequent analysis. This analysis can be done through Grafana, for example:
You can see messages being consumed by KSQL—all data from the ratings topic—and produced by it to the GOOD_IOS_RATINGS stream with messages matching the STARS >= 4 AND CHANNEL='iOS' criteria. Just by looking at it, you can determine that roughly 15% (0.26 divided by 1.96) of the messages are passing through from the ratings source to the GOOD_IOS_RATINGS target:
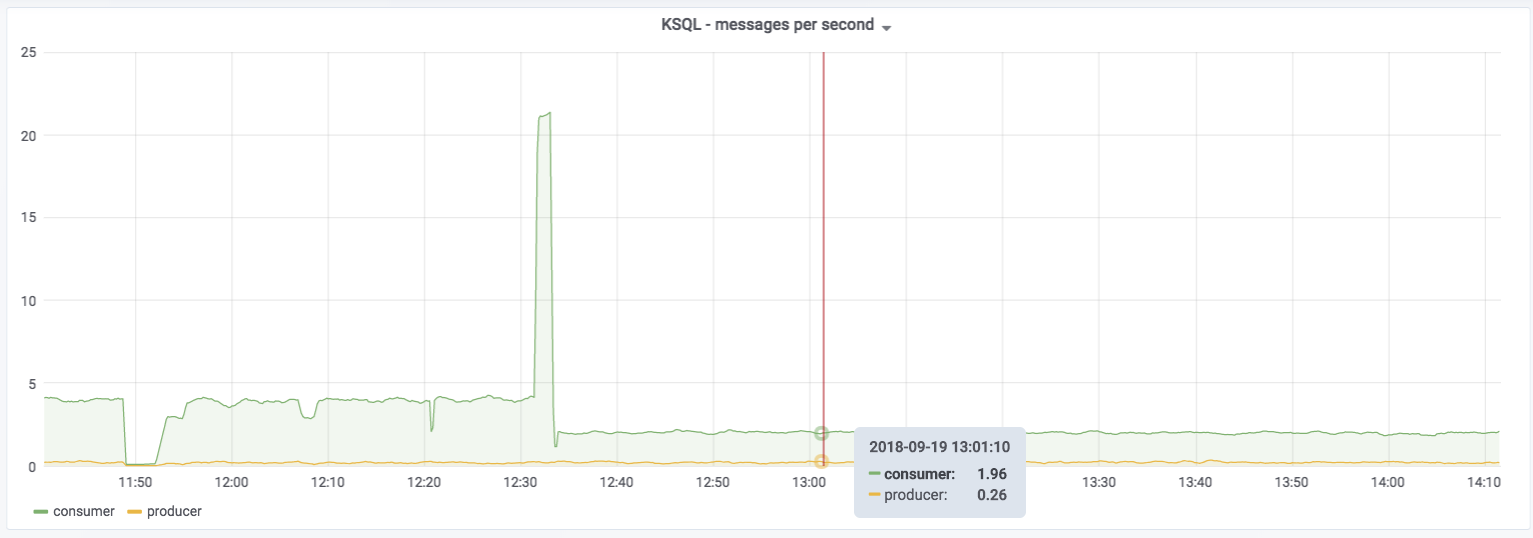
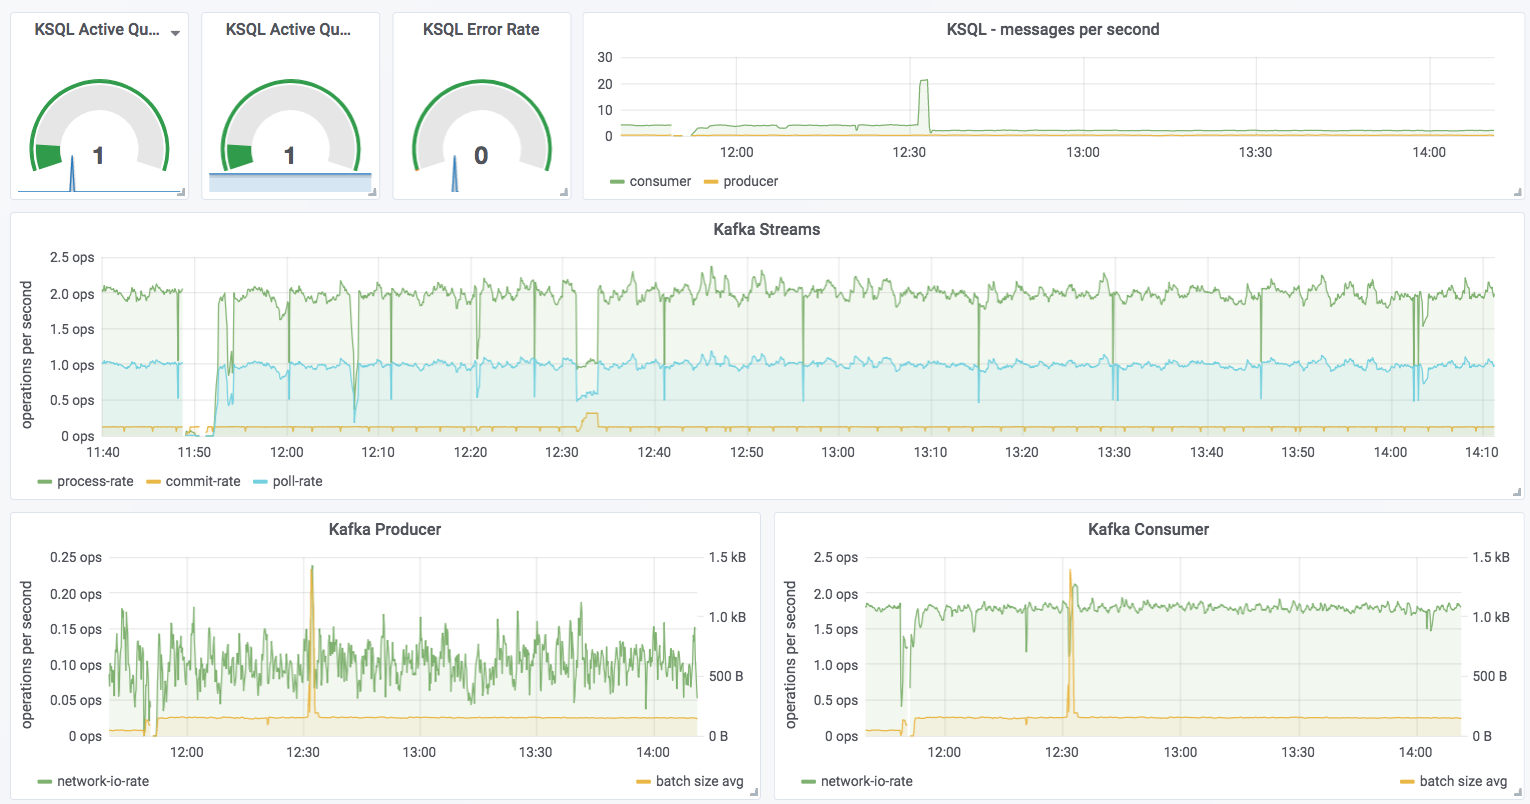
The spike at 12:31 coincides with the example I ran in part 1 of trying to read messages with the wrong serialization format defined. Conveniently enough, there’s also a JMX metric we can track for errors: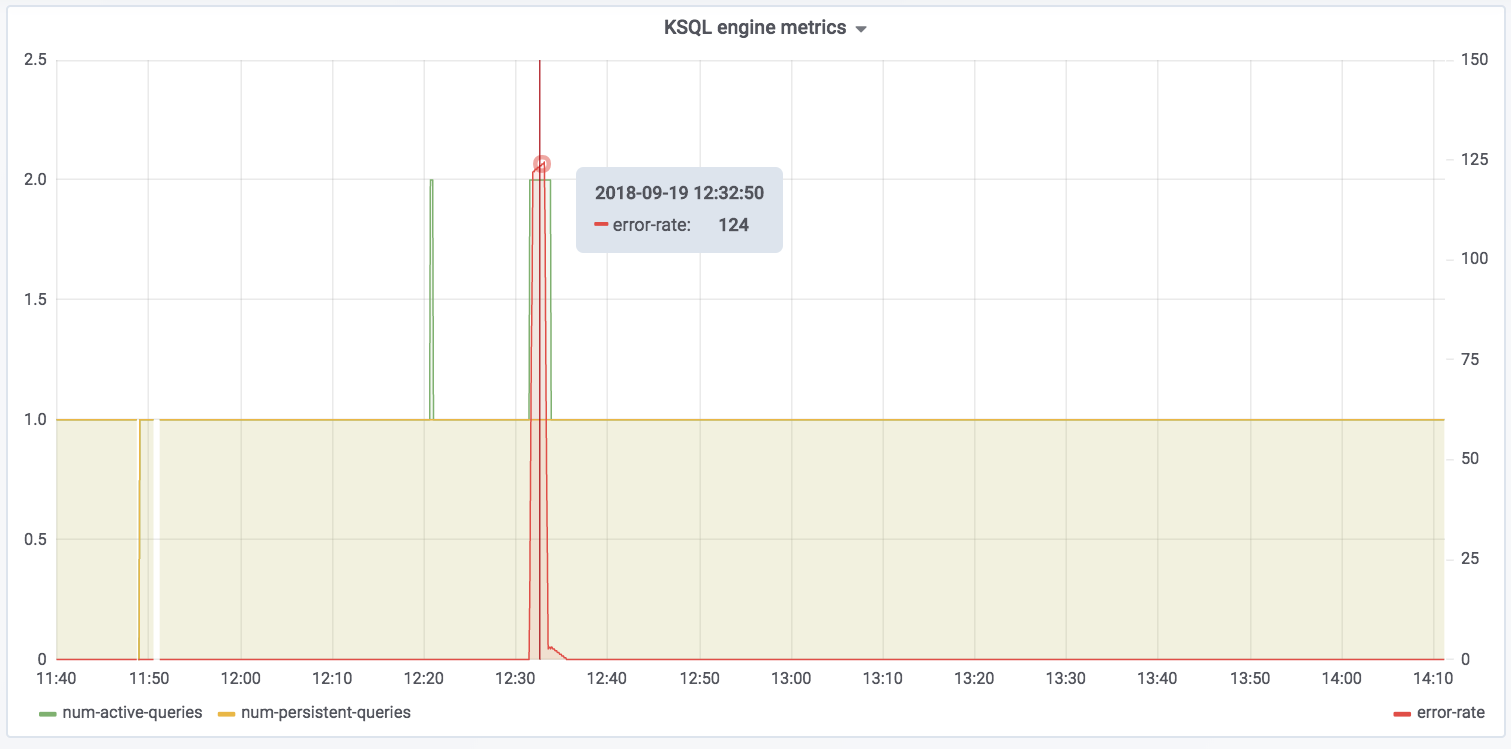
The spike in error-rate as well as the increase in num-active-queries likewise make sense, because the additional query was running against the invalid stream at the time on top of the fact that there was one already running against ratings.
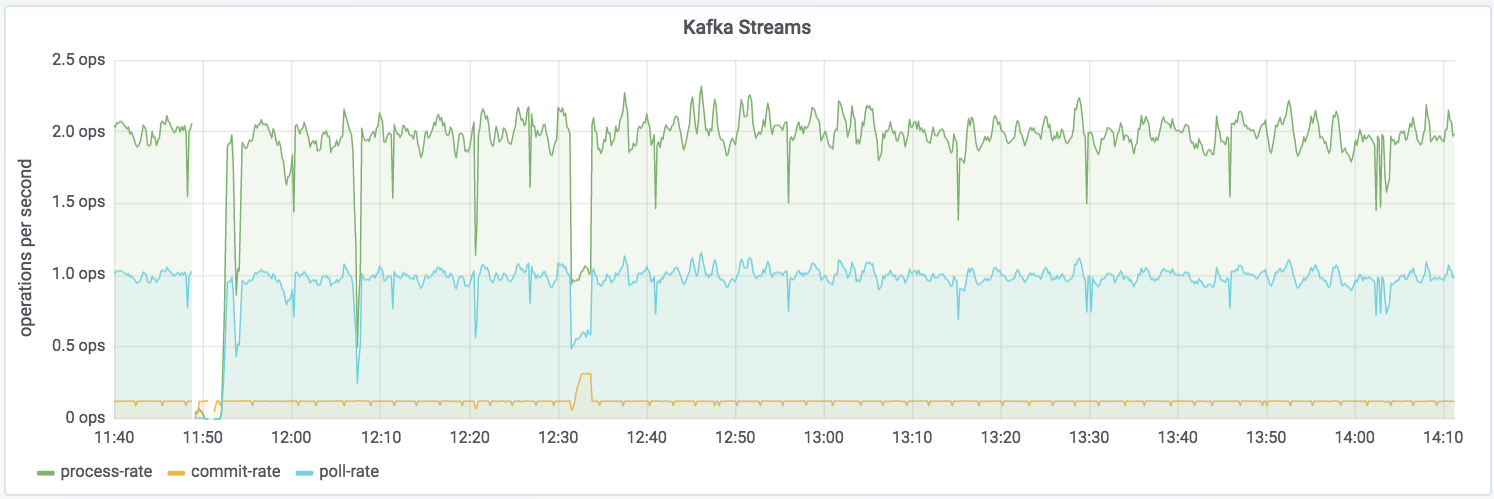
You can dig down into the underlying Kafka Streams metrics:
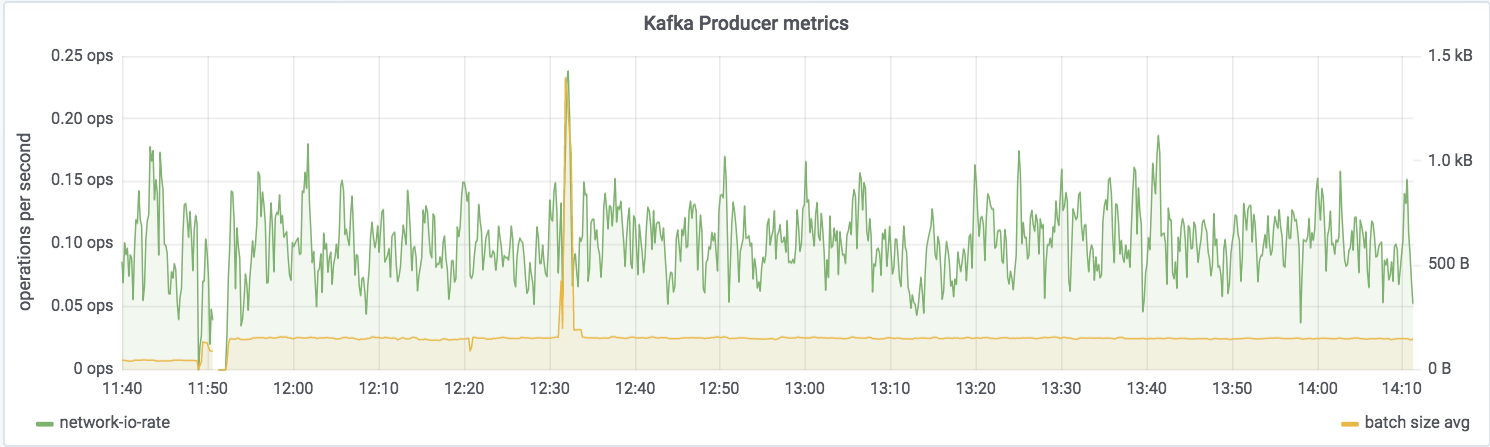
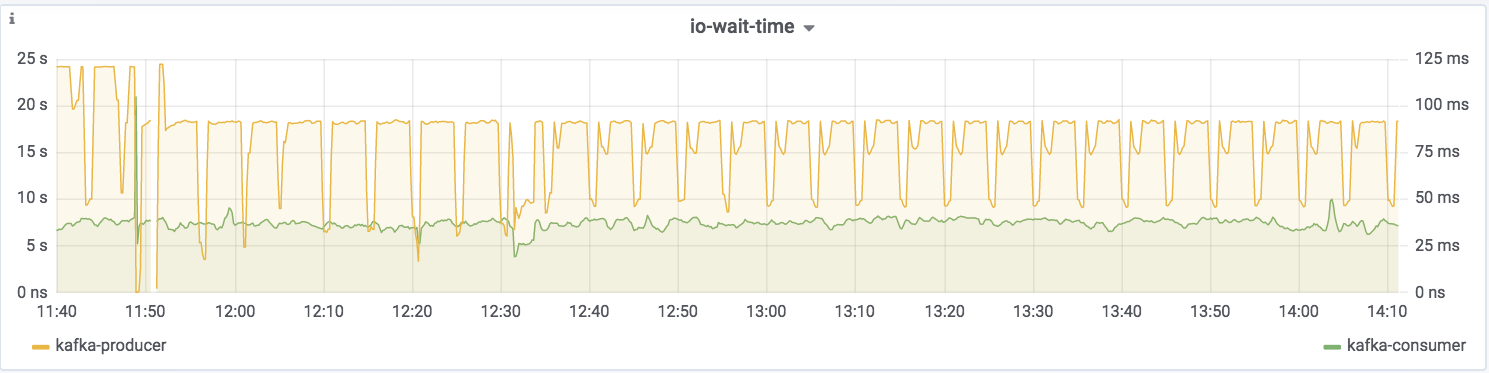
Kafka Streams itself is built on Kafka, and you can drill down to the underlying Kafka producer and consumer metrics too:
If you want to try this out for yourself and explore the JMX metrics, the complete code samples are available on GitHub.
For details of the specific metrics, see:
Need more help?
Still stuck and need more help? Here are several places to turn:
- Get support for KSQL as part of Confluent Platform
- Seek community support for KSQL:
- Ask questions in the Confluent Community Slack #ksql channel
- Search for similar issues on GitHub
- Raise a new issue on GitHub if it doesn’t already exist
- Learn about ksqlDB, the successor to KSQL, and see the latest syntax
Other articles in this series
このブログ記事は気に入りましたか?今すぐ共有
Confluent ブログの登録


Why ELT Can't Keep Up in the Era of High-Scale Data Engineering
Batch ELT pipelines create duplication, cost spikes, and governance gaps as data scales. Here’s why enterprises are rethinking legacy integration models.


How to Protect PII in Apache Kafka® With Schema Registry and Data Contracts
Protect sensitive data with Data Contracts using Confluent Schema Registry.