Running Kafka Streams Applications in AWS
This guest blog post is the second in a series about the use of Apache Kafka’s Streams API by Zalando, Europe’s largest online fashion retailer. See Ranking Websites in Real-time with Apache Kafka’s Streams API for the first post in the series.
At Zalando, Europe’s largest online fashion retailer, we are using Apache Kafka® for a wide variety of use cases. In this blog post, we share our experience and lessons learned to run our real-time applications built with Kafka’s Streams API in production on Amazon Web Services (AWS). Our team at Zalando has been an early adopter of the Kafka Streams API, where we have been using it since its initial release in Kafka 0.10.0 in mid-2016, so we hope you find this hands-on information helpful for running your own use cases in production.
What is Apache Kafka’s Streams API?
The Kafka Streams API is available as a Java library included in Apache Kafka® that allows you to build real-time applications and microservices that process data from Kafka. It allows you to perform stateless operations such as filtering (where messages are processed independently from each other) as well as stateful operations such as aggregations, joins, windowing, and more. Applications built with the Streams API are elastically scalable, distributed, and fault-tolerant: for example, the Streams API guarantees fault-tolerant data processing with exactly-once semantics, and it processes data based on event-time, i.e., when the data was actually generated in the real world (rather than when it happens to be processed). This conveniently covers many of the production needs for mission-critical real-time applications.
An example of how we are using Kafka Streams at Zalando is the aforementioned use case of ranking websites in real-time to understand fashion trends.
Library Upgrades of Kafka Streams
Largely due to our early adoption of Kafka Streams, we encountered many teething problems in running Streams applications in production. However, we stuck with it due to how easy it was to write Kafka Streams code. In our early days of adoption, we would hit various issues around stream consumer groups rebalancing, issues with getting locks on the local RocksDB after a rebalance, and more. These eventually settled down and sorted themselves out in the 0.10.2.1 release (April 2017) of the Kafka Streams API.
I/O
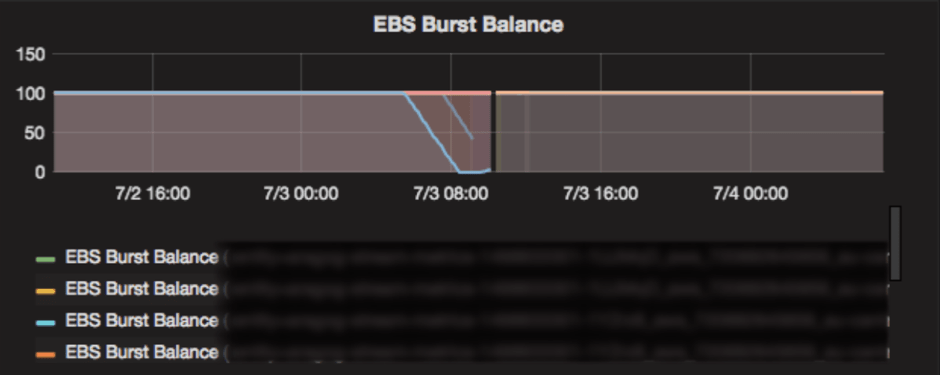
After upgrading to 0.10.2.1, our Kafka Streams applications were mostly stable, but we would still see what appeared to be random crashes every so often. These crashes occurred more frequently on components doing complex stream aggregations. We eventually discovered that the actual culprit was AWS rather than Kafka Streams: on AWS General purpose SSD (GP2) EBS volumes operate using I/O credits. The AWS pricing model allocates a baseline read and write IOPS allowance to a volume, based on the volume size. Each volume also has an IOPS burst balance, to act as a buffer if the base limit is exceeded. Burst balance replenishes over time but as it gets used up the reading and writing to disks starts getting throttled to the baseline, leaving the application with an EBS that is very unresponsive. This ended up being the root cause of most of our issues with aggregations. When running Kafka Stream applications we had initially assigned 10gb disks as we didn’t foresee much storage occurring on these boxes. However, under the hood the applications performed lots of read/write operations on the RocksDBs which resulted in I/O credits being used up, and given the size of our disks, the I/O credits were not replenished quickly enough, grinding our application to a halt. We remediated this issue by provisioning Kafka Streams applications with much larger disks, this gave us more baseline IOPS and the burst balance was replenished at a faster rate.
I/O Monitoring: EBS Burst Balance
So, how would we monitor our applications to prevent the aforementioned I/O issues in AWS to resurface again? Our monitoring solution polls CloudWatch metrics and pulls back all AWS exposed metrics. For the issue outlined, the most important of these is EBS burst balance. As mentioned above, in many cases applications that use Kafka Streams rely on heavy utilization of locally persisted RocksDBs for storage and quick data access. This storage is persisted on the instance’s EBS volumes and generates a high read and write workload on the volumes. GP2 disks were used in preference to provisioned IOPS disks (IO1), since these were found to be much more cost effective in our case.
Fine-tuning your application
With upgrades in the underlying Kafka Streams library, the Kafka community introduced many improvements to the underlying stream configuration defaults. Where in previous, more unstable iterations of the client library we spent a lot of time tweaking config values such as session.timeout.ms, max.poll.interval.ms, and request.timeout.ms to achieve some level of stability.
With new releases we found ourselves discarding these custom values and achieving better results. However, some timeout issues persisted on some of our services, where a service would frequently get stuck in a rebalancing state. We noticed that reducing the max.poll.records value for the stream configs would sometimes alleviate issues experienced by these services. From partition lag profiles we also saw that the consuming issue seemed to be confined to only a few partitions, while the others would continue processing normally between re-balances. Ultimately we realised that the processing time for a record in these services could be very long (up to minutes) in some edge cases. Kafka has a fairly large maximum offset commit time before a stream consumer is considered dead (5 minutes) but with larger message batches of data this timeout was still being exceeded. By the time the processing of the record was finished the stream was already marked as failed and so the offset could not be committed. On rebalance, this same record would once again be fetched from Kafka, would fail to process in a timely manner and the situation would repeat. Therefore for any of the affected applications we introduced a processing timeout, ensuring there was an upper bound on the time taken by any of our edge cases.
Monitoring: Consumer Lag
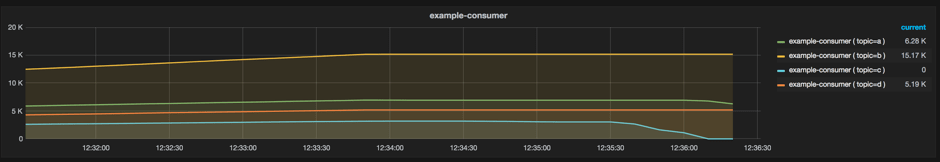
By looking at the metadata of a Kafka Consumer Group, we can determine a few key metrics. How many messages are being written to the partitions within the group? How many messages are being read from those partitions? The difference between these is called lag, it represents how far the Consumers lag behind the Producers.
The ideal running state is that lag is a near zero value. At Zalando, we wanted a way to monitor and plot this in order to see if our streams applications are functioning.
After trying out a number of consumer lag monitoring utilities, such as Burrow, Kafka Lag Monitor and Kafka Manager, we ultimately found these tools either too unstable or a poor fit for our use case. From this need, our co-worker, Mark Kelly, build a small utility called Remora. It is a simple HTTP wrapper around the Kafka consumer group “describe” command. By polling the Remora HTTP endpoints from our monitoring system at a set time interval, we were able to get good insights into our stream applications.
Memory
Our final issue was due to memory consumption. Initially we somewhat naively assigned very large heaps to the JVM. This was a bad idea because Kafka Streams applications utilize a lot of off-heap memory when configured to use RocksDB as their local storage engine, which is the default. By assigning large heaps there wasn’t much free system memory. As a result, applications would eventually come to a halt and crash. For our applications we use M4.large instances, we assign 4GB of RAM to the heap and usually utilize about 2GB of it, the system has a remaining 4GB of RAM free for off-heap and system usage, utilization of overall system memory is at 70%. Additionally, we would recommend reviewing the memory management section of Confluent’s Kafka Streams documentation as customising the RocksDB configuration was necessary in some of our use cases.
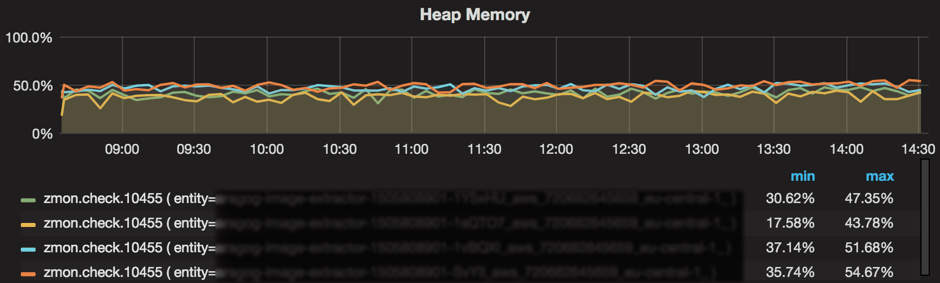
Memory Monitoring: JVM Heap Utilization
We expose JVM heap utilization using Dropwizard metrics via HTTP. This is polled on an interval by our monitoring solution and graphed. Many of our applications are fairly memory intensive, with in-memory caching, so it was important for us to be able to see at a glance how much memory was available to the application. Additionally, due to the relative complexity of many of our applications, we wanted to have easy visibility into garbage collection in the systems. Dropwizard metrics offered a robust, ready-made solution for these problems.
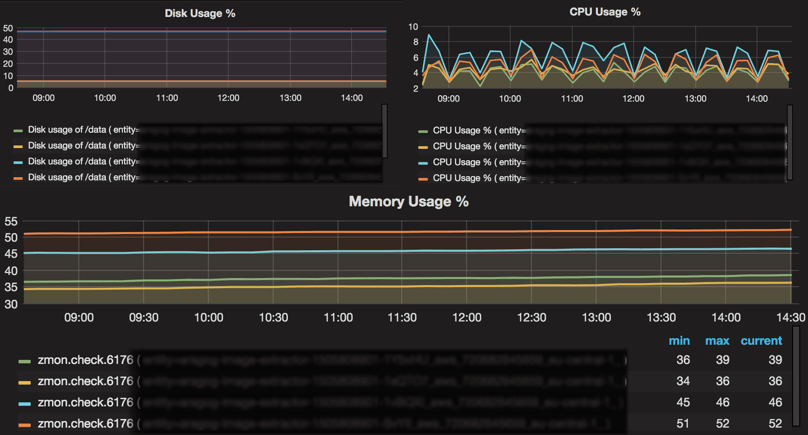
Monitoring: CPU, System Memory Utilization, and Disk Usage
There are many more metrics that we keep an eye on. We run Prometheus node exporter on all of our servers, this exports lots of system metrics via HTTP. Again, our monitoring solution polls this on interval and graphs them. While the JVM monitoring described above provided a great insight into what was going on in the JVM, we needed to also have insight into what was actually going on in the instance. In general most of the applications we ended up writing had a much greater network and memory overheads than CPU requirements. However, in many failure cases we saw, our instances were ultimately terminated by auto scaling groups on failing their health checks. These health checks would fail because the endpoints became unresponsive due to high CPU loads as other resources were used up. While this was usually not due to high CPU use in the application processing itself, it was a great symptom to capture and dig further into where this CPU usage was coming from. Disk monitoring also proved very valuable, particularly for Kafka Streams applications consuming from topics with a large partitioning factor and/or doing more complex aggregations. These applications store a fairly large amount of data (200MB per partition) in RocksDB on the host instance, so it is very easy to accidentally run out of space. Finally, it is also good to monitor how much memory the system has available as a whole, since this was frequently directly connected to CPU loads saturating on the instances, as briefly outlined above.
Conclusion: The Big Picture of our Journey
As mentioned in the beginning, our team at Zalando has been using the Kafka Streams API since its initial release in Kafka 0.10.0 in mid-2016. While it wasn’t a smooth journey in the very beginning, we stuck with it and, with its recent versions, we now enjoy many benefits: our productivity as developers has skyrocketed, writing new real-time applications is now quick and easy with the Streams API’s very natural programming model, and horizontal scaling has become trivial.
In the next article of this series, we will discuss how we are backing up Apache Kafka® and Zookeeper to Amazon S3 as part of our disaster recovery system.
About Apache Kafka’s Streams API
If you have enjoyed this article, you might want to continue with the following resources to learn more about Apache Kafka’s Streams API:
- Get started with the Kafka Streams API to build your own real-time applications and microservices.
- Walk through our Confluent tutorial for the Kafka Streams API with Docker and play with our Confluent demo applications.
このブログ記事は気に入りましたか?今すぐ共有
Confluent ブログの登録


Why ELT Can't Keep Up in the Era of High-Scale Data Engineering
Batch ELT pipelines create duplication, cost spikes, and governance gaps as data scales. Here’s why enterprises are rethinking legacy integration models.


How to Protect PII in Apache Kafka® With Schema Registry and Data Contracts
Protect sensitive data with Data Contracts using Confluent Schema Registry.