Neu in Confluent Cloud: Daten & Pipelines für KI-fähiges Streaming zugänglich machen | Mehr erfahren
How to Visualise Confluent Cloud Audit Log Data
At Confluent, we’re serious about security, and we’re focused on simplifying security visibility across our cloud and on-premises solution. This blog demonstrates how to monitor Confluent Cloud authorization events using Splunk, a leader in security information and event management (SIEM). Confluent’s announcement of general availability access to an audit logs feature available on standard as well as on dedicated clusters, allows you to monitor what users and applications are accessing on your Confluent Cloud. With audit logs you can keep a close eye on who is accessing your data and what exactly they’re doing with it. Audit logs currently capture Apache Kafka® authentication and management authorization events, in addition to Confluent’s Cluster RBAC (Role-Based Access Control) authorization events. Also note that if your organization has other preferred security vendors such as Elasticsearch, you can leverage the connectors in Confluent Hub and sink the audit log data into your service.
The Confluent Cloud user interface provides a modern look and feel to manage your cloud resources, while allowing you to view your event data while it’s in motion. Tools such as Splunk are purposely designed for cybersecurity monitoring and are used by analysts to identify security threats and/or any potential breaches. Visualising Confluent Cloud audit logs in Splunk allows organizations to improve their security posture by correlating audit activity with complimentary security data sources, ultimately securing your mission-critical event streaming platform.
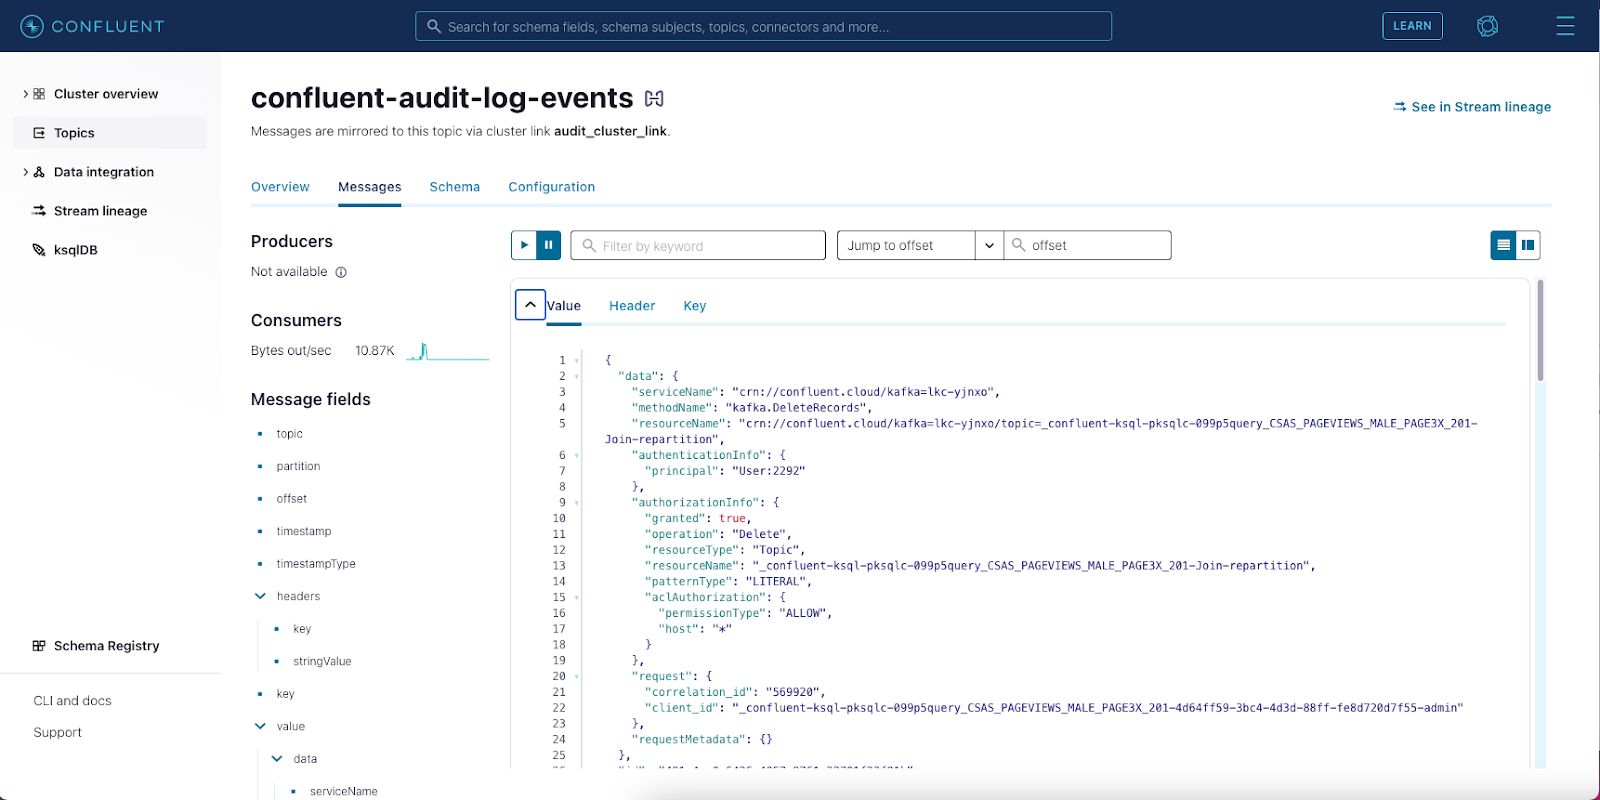
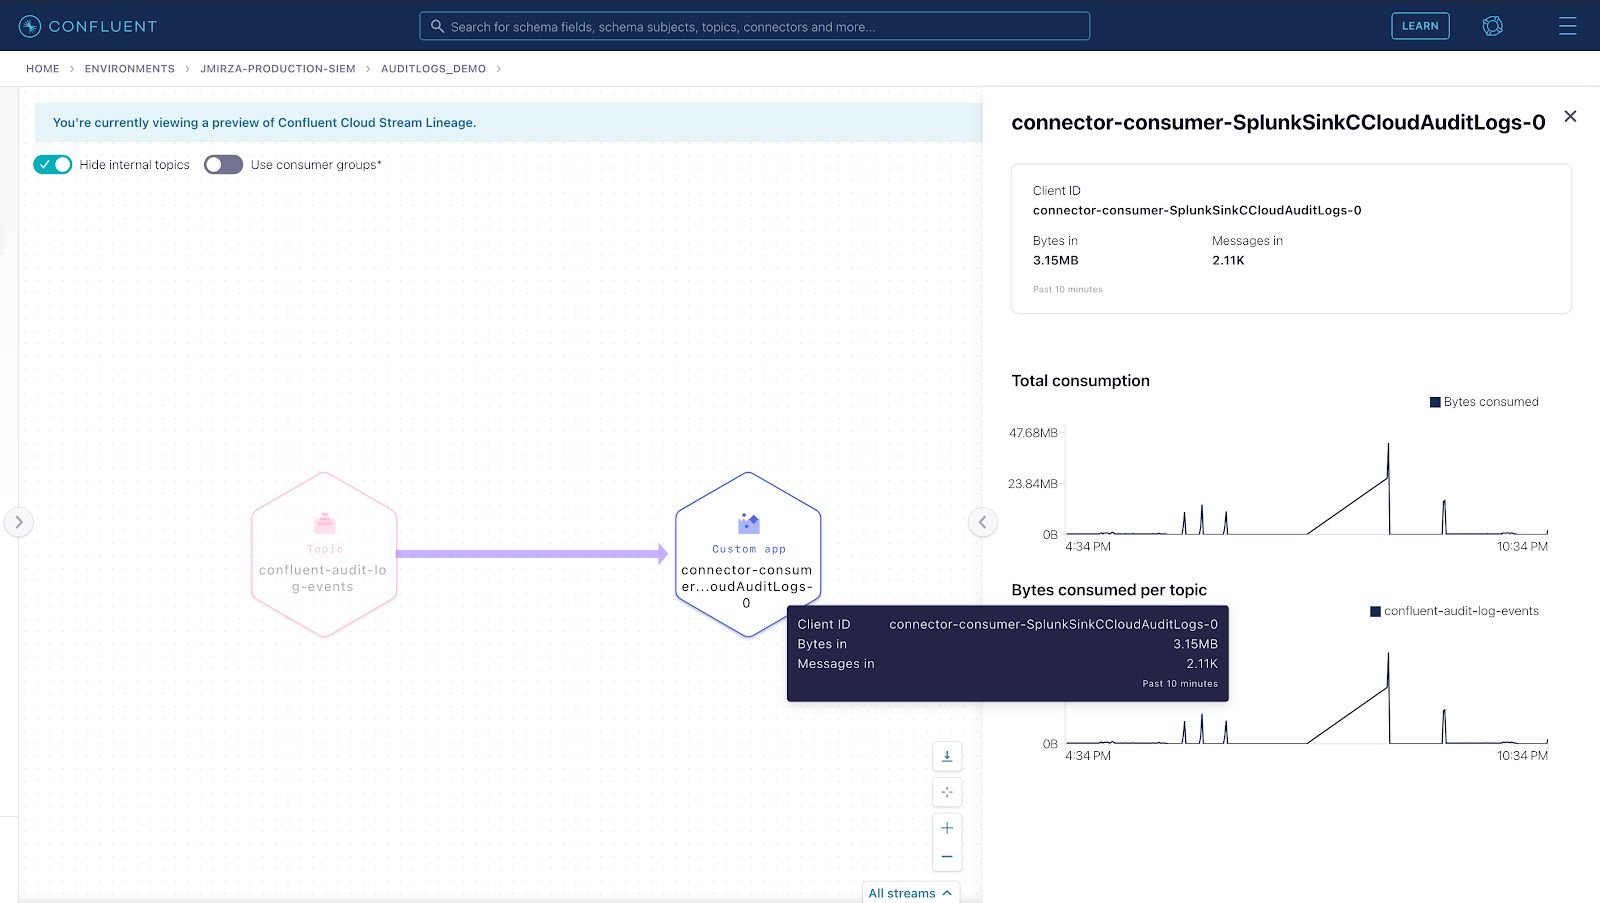
Accessing your Confluent cluster’s audit logs is outlined in this documentation. You can consume the audit logs using an API, the Confluent Cloud CLI, or even with your own custom consumer. Another great option is to use Confluent Cluster Linking to mirror the “confluent-audit-log-events” topic to a destination on a Confluent Cloud dedicated cluster. Confluent Cloud’s REST API also allows you to provision and manage Cluster Linking in your own product using your CI/CD pipeline.
Confluent Cloud audit logs are not only useful for governance and security, but also for events or marketing campaigns run by your organization. For example, the Confluent Australia and New Zealand team sponsored the GovHack hackathon—the largest open data hackathon in the southern hemisphere—and used Confluent Cloud’s audit logs to monitor and visualise activities of the participating teams who were using Confluent Cloud for their competition. These dashboards helped the team at Confluent to run the hackathon with information about who and how different teams were accessing data in their topics, to know if they were using the right API keys, and even helped with troubleshooting access and permissions issues of the hackathon participants.
The following illustration is an example of how to gain valuable insights into your audit logs. In the images you can see a “Confluent Cloud Audit Overview” dashboard that highlights a high-level user’s activity within an organisation. This includes charts showing what resources a user or client is accessing, if there are any failed authentication attempts, and how often they occur. If you’re following along, the illustration then selects a specific user to focus in on their activity. Next, is another dashboard called “Confluent Cloud Role Assignments” where we drill down further to understand what roles the principal user has assigned. From the lens of a security analyst, this now provides great context to further investigate the assigned permissions for the principal user.
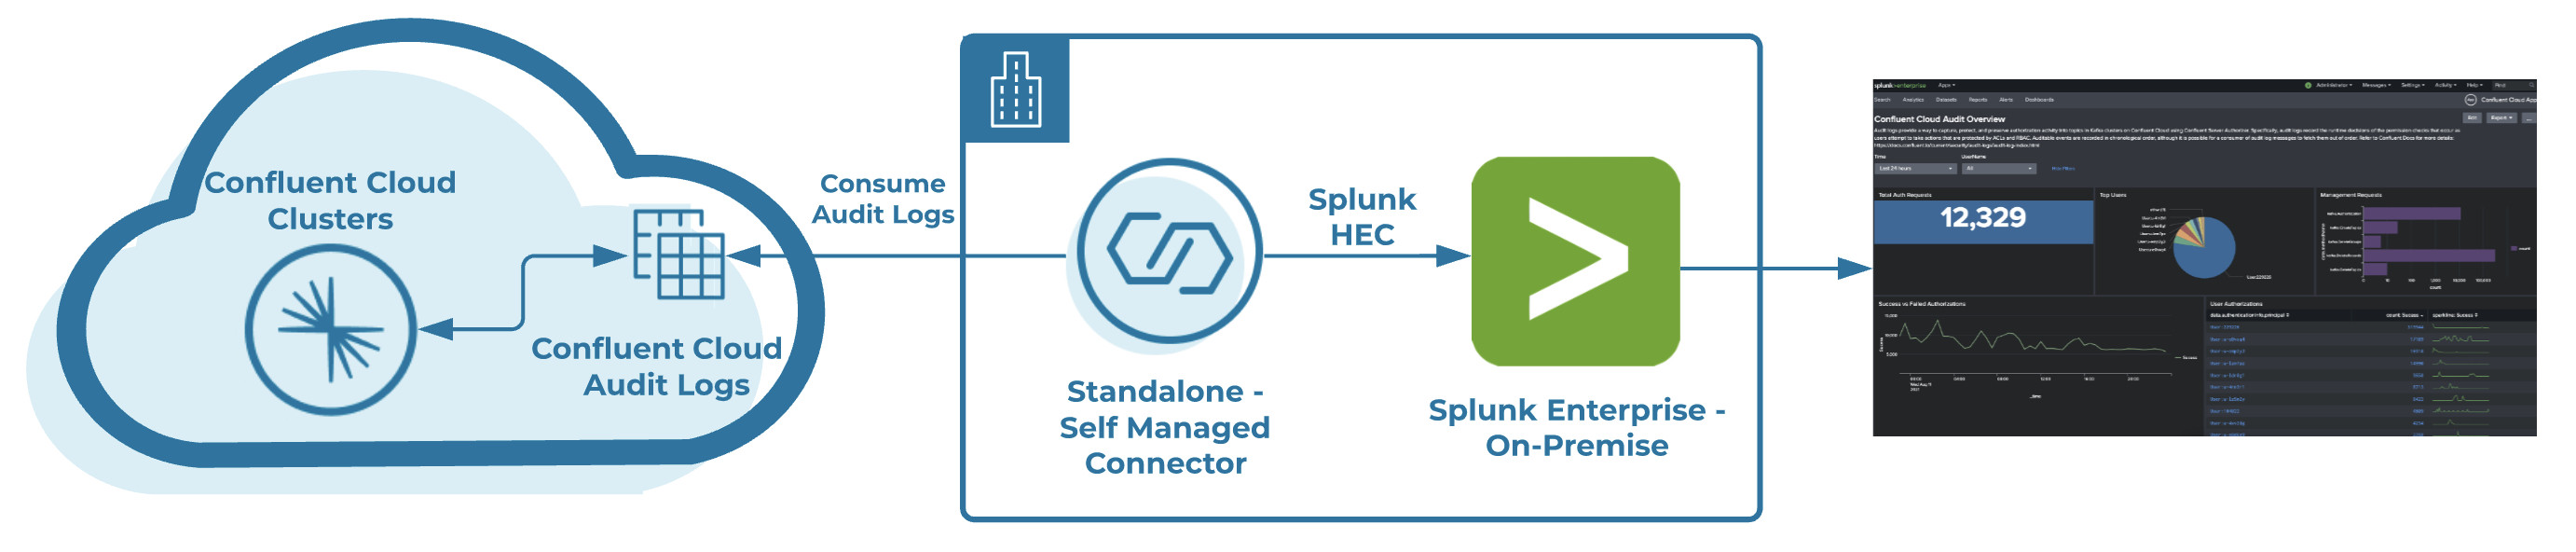
This solution helps you set up a self-managed connector to consume from your Confluent Cloud audit logs cluster using Kafka Connect, and sink to a Splunk Enterprise instance running locally in Docker. The guide also helps you configure your Confluent Cloud environment and get access to your audit logs, then deploy a Splunk app, which is a pre-built and out-of-the-box set of visualisations that enable you to discover valuable insights from your Confluent Cloud audit logs.
Visualizing audit logs of Confluent Cloud
Some of Confluent’s employees who are Splunk enthusiasts have taken on an initiative to create and contribute to this Confluent Cloud Splunk App, which is an application that runs on the Splunk platform and is designed to analyze and display knowledge around a specific data set. Included in the app are two dashboards, “Confluent Cloud Audit Overview” and “Confluent Audit Role Assignments,” which help you monitor and investigate your audit activity in Confluent Cloud. Refer to this GitHub repository, and you can be up and running in a few simple steps. If you are already using Splunk Enterprise or Splunk Cloud, you can configure Kafka Connect to point to your Splunk instance by modifying the HTTP Event Collector (HEC) endpoint. Scroll down toward the bottom of this page for more detailed information.
This is the first release of the Confluent Cloud Splunk app. Some additional features that we would love to see added in a future release include:
- Improvements to the audit log dashboard as new data and fields are published to the structured audit logs
- Integrate Confluent Cloud Connect error logs for troubleshooting Confluent Connect errors
- And to add metrics from the Confluent Cloud Metrics API
Here’s a first impression of what we’ll have built at the end of this blog:
To get started, you need to set up and build the following components to run in a local Docker instance.
- A Confluent supported self-managed Splunk sink connector
- Splunk Enterprise instance using Docker
- The Confluent Cloud Splunk app that will automate the install of a pre-built app (Not supported by Confluent)
Also provided below is another option (option B) that enables you to configure the Splunk sink connector to point to your existing on-premises Splunk Enterprise instance or to your Splunk cloud service.
Getting started
You first need to get some information about your Confluent cluster that has audit logs enabled.
- To access your audit log credentials, log in to Confluent Cloud and then navigate to the hamburger menu (top right), then click on “Audit log.”
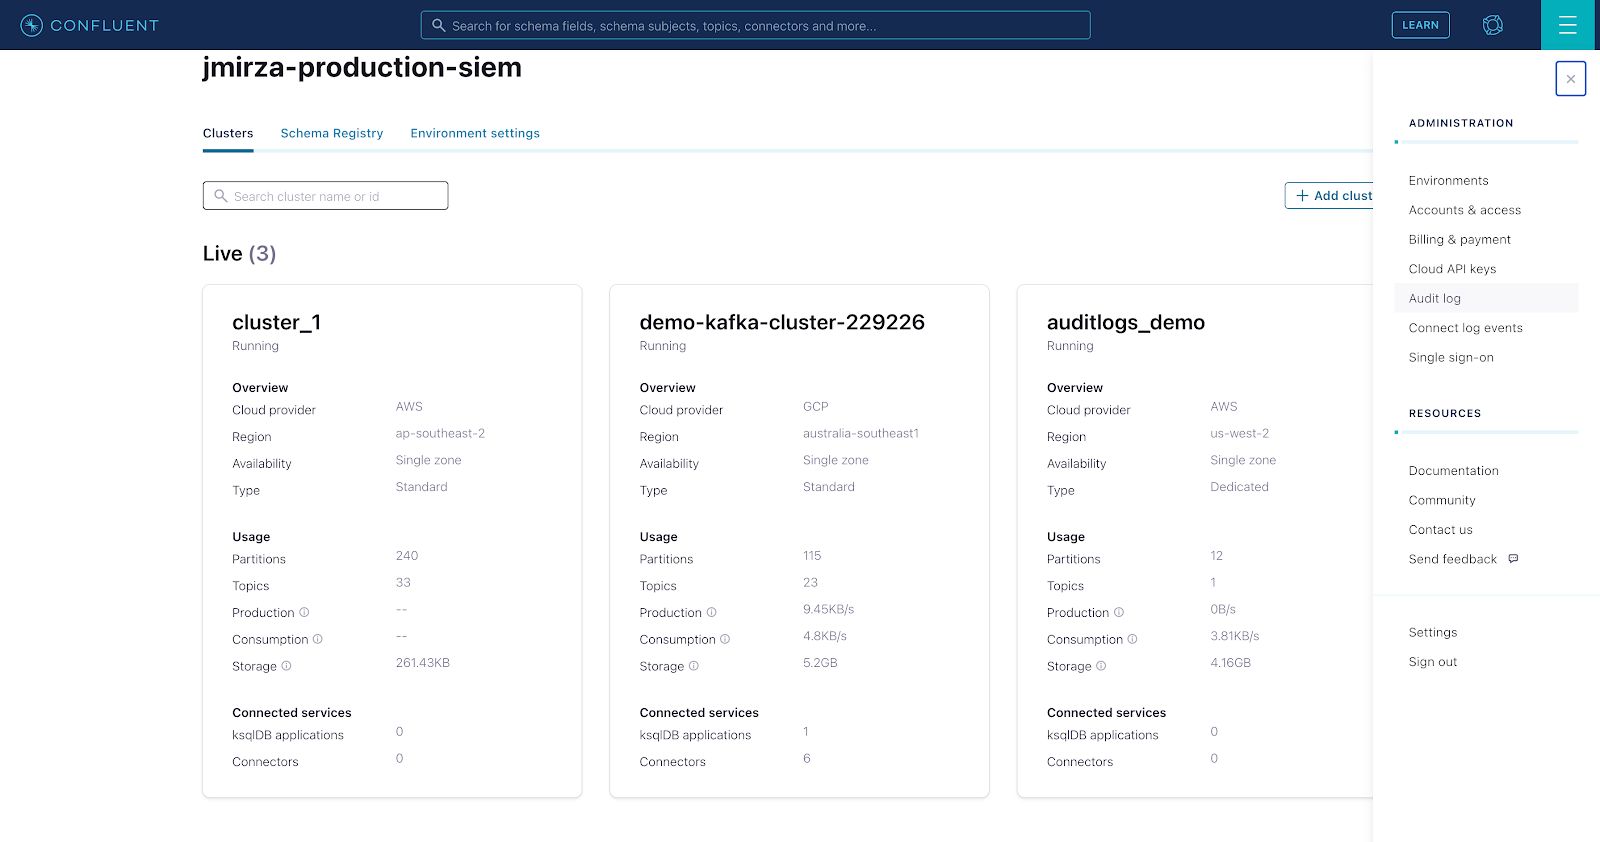
- Create your “API key” and “Secret” by following the steps in your choice of the three options: “Consume with CLI,” “Consume with Java,” or “Consume with C/C++.” Take note of the following configuration values as you will need them to configure access later on.
+-----------------+-------------------------------+
| Cluster         | lkc-xxxx                      |
| Environment     | env-xxxx                      |
| Service Account | 17xxxx                        |
| Bootstrap Server| pkc-*.confluent.cloud:9092    |
| Topic Name      | confluent-audit-log-events    |
| API Key         | xxxx                          |
| API Secret      | xxxx                          |
+-----------------+-------------------------------+
To make the configuration as easy as possible to configure, the repo includes an env.sh environment file which is all you need to complete your cloud credentials and access your Confluent Cloud audit log cluster. Here is an example:
BOOTSTRAP_SERVERS=(Audit Log Bootstrap server captured above)
SASL_JAAS_CONFIG="org.apache.kafka.common.security.plain.PlainLoginModule required username=’Audit Log Cluster API Key’ password=’Audit Log Cluster API Secret’;"
Before going any further it’s worth pointing out that the Confluent Cloud audit log cluster does not allow you to create any offsets topics for your consumers. This means that offsets need to be stored on either a separate Kafka broker/cluster or to a local file in Connect standalone mode. Changing the default offsets location in Docker requires some customization which generates a new Kafka Connect image. The examples in the Confluent documentation will help you to build your own self-managed (Splunk sink) Kafka connector, and specify custom environmental variables for storing consumer offsets. Depending on your preference, if you are following along with this blog, we recommend running Kafka Connect in standalone mode. If you want to put this setup in production, however, we recommend the distributed mode for more reliability.
For more information on how to build a new custom Kafka Connect image, reference the Confluent cp-all-in-one repository for more details. In the following steps you will build a new custom Kafka Connect image with a Splunk Sink pointing to your Docker instance by running the below command:
docker build \
    --build-arg CONNECTOR_OWNER=${CONNECTOR_OWNER} \
    --build-arg CONNECTOR_NAME=${CONNECTOR_NAME} \
    --build-arg CONNECTOR_VERSION=${CONNECTOR_VERSION} \
    -t localbuild/connect_standalone_with_${CONNECTOR_NAME}:${CONNECTOR_VERSION} \
    -f ./Docker-connect/standalone/Dockerfile ./Docker-connect/standalone
The build may take a couple of minutes to complete as it needs to pull down the confluentinc/cp-server-connect-base image, then build a new local image with the name localbuild/connect_standalone_with_${CONNECTOR_NAME}:${CONNECTOR_VERSION}.
Alternative option
If you are already using Splunk Enterprise or Splunk Cloud in your organization, you can manually configure the Splunk sink connector to push to your Splunk instance by following these actions:
- Modify the below variables in the docker-compose.yml file
- CONNECTOR_SPLUNK_HEC_URI: https://{splunkhecendpoint:8088}
- CONNECTOR_SPLUNK_HEC_TOKEN: {splunkToken}
And finally, it’s time to bring up some dashboards. The Splunk app from our repository has a couple of great pre-built dashboards to help you visualise the Confluent Cloud audit logs. There are two main dashboards: “Confluent Cloud Audit Overview” and “Confluent Cloud Role Assignments.” As an example, you can reference this GitHub repository that will run Splunk Enterprise with a pre-configured Splunk HTTP Event Collector Token, and will automatically install the Splunk app.
Next steps
At this point, you are all set to experiment with the visualizations of your audit log data from Confluent Cloud!
If you are interested in learning more about Confluent and Kafka Connect, take a look at our free Kafka Connect 101 course on Confluent Developer. You can also get started with a free trial of Confluent Cloud, our cloud-native, fully managed service for Kafka to set your data in motion. Use the code CL60BLOG to get an additional $60 of free usage.*
Ist dieser Blog-Beitrag interessant? Jetzt teilen
Confluent-Blog abonnieren


Customer Intelligence Hub: A Single Pane of Glass for Customer Insight and Action
Customer Intelligence Hub unifies customer signals into a real-time, AI-powered view that helps GTM teams prioritize risk, identify opportunity, and act faster with contextual insights.