Neu in Confluent Cloud: Daten & Pipelines für KI-fähiges Streaming zugänglich machen | Mehr erfahren
Scaling Apache Druid for Real-Time Cloud Analytics at Confluent
How does Confluent provide fine-grained operational visibility to our customers throughout all of the multi-tenant services that we run in the cloud? At Confluent Cloud, we manage a large number of multi-tenant Apache Kafka® clusters across multiple cloud providers, including Azure, GCP, and AWS. We also manage various other services including ksqlDB, Kafka Connect, and Confluent Schema Registry. To deliver the best user experience, it is crucial that we offer real-time monitoring and operational visibility to our customers into the mission-critical workloads they run on our infrastructure. It is also paramount for us to have a highly scalable internal system that provides analytical capabilities for our day-to-day cloud operations, such as billing.
At Confluent, we use Apache Druid, a column-based distributed database used for real-time analytics and designed to ingest high volumes of data and provide low-latency queries. This article reviews our telemetry pipeline architecture and shares a few techniques that make our backend more scalable to meet our growing needs at Confluent.
Druid plays an important role in our monitoring and analytics platform and powers many internal and external use cases at Confluent. Among customer-facing solutions, we use Druid for Confluent Cloud monitoring dashboards, Confluent Health+ (an alerting and notification solution), Confluent Stream Lineage, and Confluent Cloud Metrics API. Inside Confluent, we use Druid to provide usage data for cloud billing and to perform ad hoc diagnostics queries. The insights from Druid also are used internally within automated control plane workflows like Kafka cluster shrink and expansion.
Since we first set up our Druid clusters, the volume of telemetry data collected from our customer clusters has continuously grown. So, we’ve needed to scale up our Druid deployments to support the increasing ingestion rate and query rate. By design, Druid is horizontally scalable. This means, by adding more hardware resources, we should be able to scale the system. But can we do better?
Why Apache Druid?
Before migrating to Druid, we used a non-time-series NoSQL database to store and query our telemetry metrics. As the volume of data grew, our legacy pipeline struggled to keep up with our data ingestion and query loads. It also wasn’t suitable for some new use cases like the Confluent Cloud Metrics API we have on top of Druid today that customers query directly.
We identified that many of the technical challenges with scaling our legacy pipeline stemmed from a lack of time-series data support and the inability to handle high-cardinality metrics in high volume. We decided that our next-generation observability pipeline needed to support:
- Substantially increased data and query load (100x)
- Sub-second query latencies on high-cardinality metrics
- Inherent time-series data support
We reviewed solutions like Apache Druid, Apache Pinot, and Clickhouse that seemed to satisfy the above criteria. Unfortunately, the tech stack needed for Clickhouse didn’t fit our needs as it involved writing C++ plugins if we wanted to read custom format data from Kafka. Between Druid and Pinot, we decided to go with Apache Druid for the following reasons:
- Druid had better documentation at the time (2019)
- We had in-house expertise in Druid
- Druid is proven to handle high-cardinally metrics at scale and is optimized for time-series data
High-level architecture
All Confluent Cloud clusters, as well as customer-managed, Health+-enabled clusters, publish metrics data to our telemetry pipeline as shown below in Figure 1. Under the hood, the telemetry pipeline uses a Confluent Cloud Kafka cluster to transport data to Druid. We use Druid’s real-time ingestion to consume data from the Kafka cluster.
On the data consumption side, we either use our Confluent Cloud Metrics API service to talk to Druid or we query Druid directly. The Metrics API receives queries over HTTPS and converts them into Druid queries. It serves multiple customer-facing use cases like powering Confluent Cloud monitoring dashboards or integrating with third-party monitoring systems. Inside of Confluent it is used to help power Health+ intelligent alerts, billing solutions, and many analytical operations. Besides the Metrics API, engineers often execute ad hoc queries directly against Druid for debugging purposes in our cloud infrastructure.
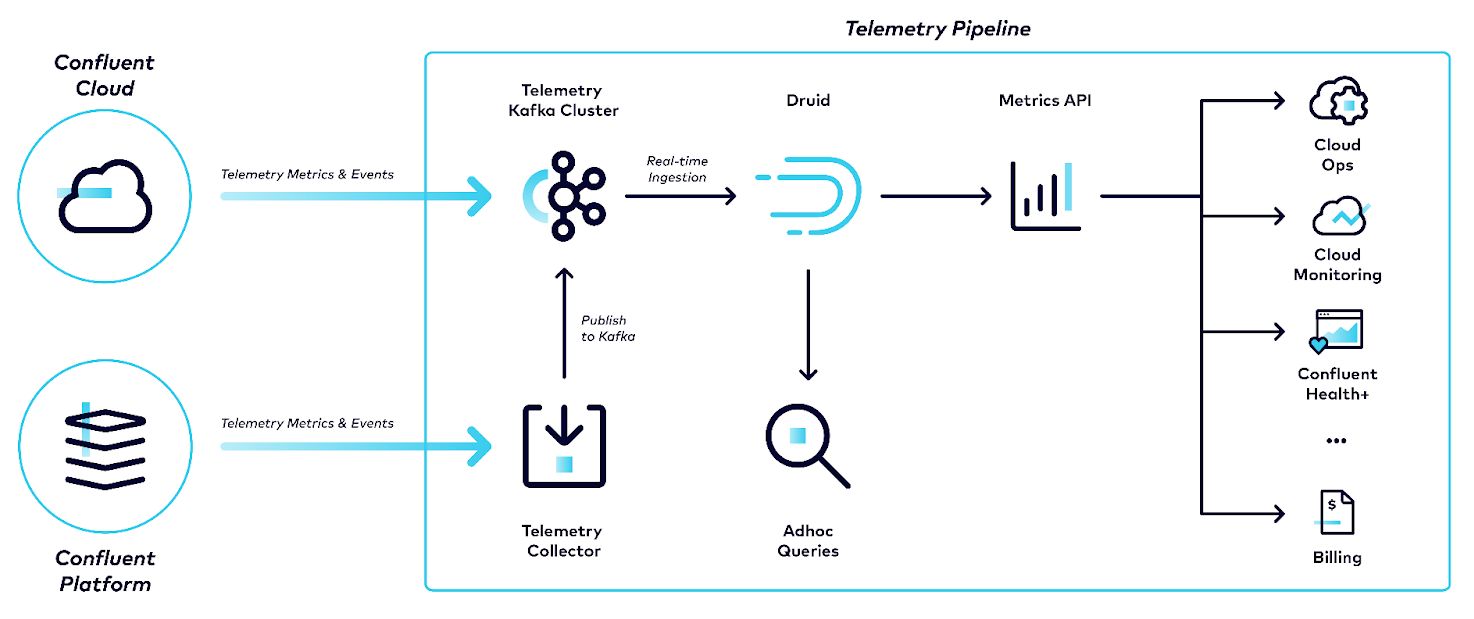
Figure 1. Telemetry pipeline at Confluent
Our Druid setup
We deploy our Druid clusters in Kubernetes clusters managed by EKS (Amazon Elastic Kubernetes Service) using Helm. We adopted the same deployment model that is used for the rest of Confluent Cloud. If you are not familiar with Druid’s architecture, you can read more about it on Druid’s website. For different Druid services we use different AWS instance types in our deployments. At the time of writing, our largest Druid cluster deployment uses more than 100 nodes for Historical processes and about 75 nodes for MiddleManager processes. We ingest over three million events per second and respond to over 250 queries per second. We keep seven days of queryable data in Druid Historical nodes and two years of data retention in S3 deep storage.
Scaling Apache Druid
Divide and conquer: Not all queries are created the same!
Splitting the data source
Querying metrics with high-cardinality dimensions (like “Kafka partition” with a cardinality of 1000+) requires reading from a large number of segments, resulting in expensive queries. Since only a small subset of our metrics contain such dimensions, we filtered them out during ingestion into a separate data source. This helped decrease the number of segments queried for high-cardinality metrics. As a result, the spikes in the latencies were smoothed out and p95 improved around 30%.
Data tiering
In Druid, Historical nodes hold immutable data segments, which have been published by the real-time nodes. On our cluster, these Historical nodes contain data for seven days. We observed that more than 90% of our queries read from the most recent 15 minutes of ingested data. Most of these queries scrape metrics to populate other monitoring systems. On the other side of the spectrum, we have fewer but more expensive queries that read from wider time spans of older data.
Initially, we stored all of our historical data, old and recent, in a single tier served by a single instance type. The retention and disk usage were similar on all of the nodes, so the share of the CPU was the same for all types of queries. We observed that, in some cases, queries for large time ranges tied up the historical resources. This resulted in many shorter and lighter queries waiting for processing resources to time out. As a solution, we separated recent data (hot) from older data (default). Then, we assigned more CPU resources to the hot data tier.
As mentioned previously, we use Kubernetes to manage our clusters. Kubernetes and Helm helped us implement this new tier quickly. We started with a StatefulSet for all Historicals and then added a second StatefulSet with the setting druid.server.tier=hot. Then we limited the retention on this hot tier to a few hours, as shown in Figure 2. Although we still use the same type of node for hot tier, we load less data on each node so the hot data can enjoy more share of the CPU. This change helped to drastically reduce timeouts on queries going to the hot tier and lowered p95 by 75%.
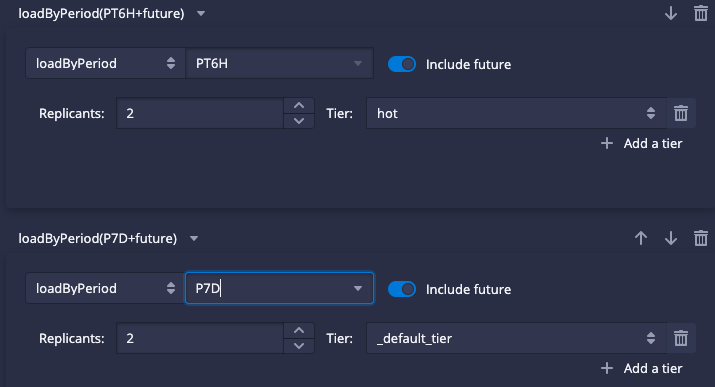
Figure 2. Setting retention for data tiers
Query laning
Query prioritization is an important consideration when serving multiple use cases, particularly when external customers are involved. A heavy ad hoc query made by a support engineer should have lower priority than one serving a customer. Similarly, a query reading from higher cardinality data should not get in the way of simpler queries, and those reading from low-cardinality data.
To account for these requirements, we added a slow-lane for the execution of lower-priority queries. This can be set in the query context:
“Context” : { "lane": "slow-lane" }
We can set the percentage of threads assigned to the slow lane via the broker configurations. In our case, we decided to use just 2% of the query threads for processing the queries in the slow lane.
druid.query.scheduler.laning.lanes.slow-lane:2
Addressing the bottlenecks
When we first set up our Druid cluster, we used r5.xlarge (4 CPUs, 32GB RAM) nodes which were the default type available on our cluster. After the need for scaling became more evident, we identified the bottlenecks for each service and optimized the nodes accordingly.
MiddleManagers
MiddleManagers have multiple responsibilities. The two main responsibilities are ingestion of incoming events and responding to real-time queries. In addition, they can be used for executing tasks like compaction, which is discussed in the next section.
With the default r5.xlarge instance type, we configured Druid to run only one task on each MiddleManager. We couldn’t scale beyond one because of the CPU resource constraints, especially during task handoff. With the growth of incoming events, instead of horizontally scaling by adding more MiddleManager nodes, we migrated them to a larger, more CPU-optimized node type, c5.9xlarge (36 CPUs, 72GB RAM) for the following reasons:
- A larger instance type would enable us to run more tasks per MiddleManager, reducing the fleet size and operational toil
- Better resource sharing by running multiple tasks on each MiddleManager
- Vertical scaling is cost-effective compared to horizontal scaling
After performing experiments to figure out the task capacity of each MiddleManager, we tuned druid.worker.capacity to a maximum of ten tasks, instead of just one. By switching to a new instance type, we reduced costs by ~60%, the number of nodes by 90%, and improved p50 query performance by ~66%.
Historicals
We initially used 512GB of external storage for each Historical node. With the growth of data, the number of Historical pods grew to hundreds. Our experiments showed that increasing the size of the external storage could make the disk IOPS a bottleneck. This observation motivated us to explore AWS instance types with local storage. We chose i3.2xlarge (8 CPUs, 61GB RAM) with 1.9TB of local storage. The migration not only reduced the number of Historical pods to a third, but also reduced the cost of Historical nodes by 40%, and timeout errors by 50%. The improved latencies attributed to faster access to local storage.
Deploying nodes with local storage can increase MTTR (mean time to recovery) in case of a Historical pod failure. We tuned replicationThrottleLimit and increased segmentCache.numLoadingThreads to speed up loading data from S3 and ensure MTTR is kept under 30 minutes.
Compaction
Compaction, a feature provided by Druid, can be used in different ways. We use compaction to reduce the number of segments read by each query. During ingestion, for each 15-minute time chunk, we create hundreds of relatively small (150MB on average) segments that each contain at most five million rows. A query with a seven-day interval needed to read from a large number of segments.
We use the hash compaction strategy which reorders rows based on the hash value of given keys. numShards determines the number of segments generated by the compaction algorithm. We can set it by dividing the approximate size of the data in each time chunk by our target average segment size, which was around 1GB in our case. As for keys, we use a combination of metric name and cluster name labels that are commonly used as filters in our queries. This hashing improves data locality for individual queries as fewer segments need to be scanned for processing a query. The similarity of adjacent data also helps with better columnar compression and reduces the overall storage needs. The size of our data source with high-cardinality metrics was reduced by 66% and frequent spikes in p95 were removed as shown in Figure 3.
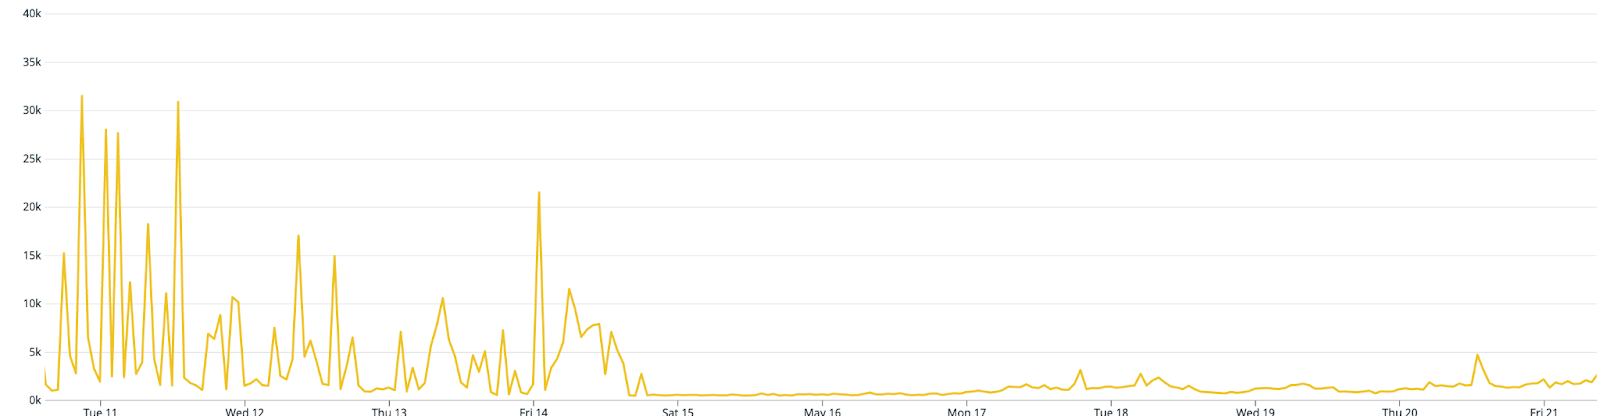
Figure 3. The impact of compaction on p95 of Historical query latencies
As for the execution of the compaction tasks, they can either be initiated manually or automatically via the Coordinator. We chose automatic compaction because we wanted it running all the time. This feature also enabled us to set up the compaction once and let the Coordinator manage running the tasks for us.
Compaction challenge: Isolation from ingestion!
Since both ingestion and compaction tasks are executed by MiddleManagers, the compaction tasks could lead to the unavailability of ingestion task capacity in two ways:
- By mistake, engineers could increase the compaction capacity before increasing MiddleManagers and cause lag in real-time ingestion.
- When a compaction task is created for an interval that is actively ingesting data, the compaction task may fail. In the case of such repeated conflicts, multiple tasks can fail. The Overlord, which is Druid’s task scheduler, may blacklist MiddleManagers with high failure rates which reduces ingestion capacity.
To eliminate the worry of interrupting ingestion, we used Kubernetes/Helm to add a separate StatefulSet and setting druid.worker.category=batch. Then, we dedicated this tier of MiddleManagers called batch to run tasks related to compaction. The “Overlord Dynamic Config” is used to map task types executed during hashed compaction to run on a batch tier as shown below:
{
  "type": "equalDistributionWithCategorySpec",
  "workerCategorySpec": {
    "categoryMap": {
      "compact": {
        "defaultCategory": "batch",
        "categoryAffinity": {}
      },
      "partial_index_generate": {
        "defaultCategory": "batch",
        "categoryAffinity": {}
      },
      "partial_index_generic_merge": {
        "defaultCategory": "batch",
        "categoryAffinity": {}
      },
      "index_kafka": {
        "defaultCategory": "_default_worker_category",
        "categoryAffinity": {}
      }
    },
    "strong": true
  }
}
Compaction challenge: Too big to compact!
Each compaction task works on one time chunk. Apache Druid recommends the maximum number of total segment bytes processed per compaction task not to be too far above 1-2GB. In automatic compaction, inputSegmentSizeBytes is set to 400MB, by default. The runtime of compaction tasks was a challenge for us since the size of each time chunk for our datasource is huge (~90GB).
When a compact task starts, after an initial phase, a few rounds of indexing tasks run. The number of these index tasks in each round is determined by maxNumConcurrentSubTasks in the settings. Once the indexing is done, one or more rounds of merge tasks conclude the compaction. The number of merge tasks is set by totalNumMergeTasks and can be set equal to numShards so each merge task generates one segment.
The code below shows an example of a compact task setting running on a 15-minute time chunk with 90GB of data. Considering the future growth, we increased inputSegmentSizeBytes to 200GB, which is 2x larger than our current chunk size, to let automatic compaction tasks work on our datasource. maxNumConcurrentSubTasks and totalNumMergeTasks were respectively set to 35 and 100. Note that we skip compaction of the last three hours of data. This is a conservative measure to prevent compaction tasks from working on the segments still getting ingested. As discussed in the previous section, assigning separate MiddleManagers for compaction protects ingestion from the negative impact of such conflicts but it can still lead to frequent compaction task failures.
Figure 4 shows various tasks run during hashed compaction, their number, and their approximate runtimes. Since each of these compact tasks finish in around two hours, we increased compaction capacity and assigned enough batch MiddleManagers to be able to run around eight compact tasks in parallel.
{
  "dataSource": "metrics",
  "inputSegmentSizeBytes": 200000000000,
  "skipOffsetFromLatest": "PT3H",
  "tuningConfig": {
    "partitionsSpec": {
      "type": "hashed",
      "numShards": 100,
      "partitionDimensions": [
        "metric",
        "cluster"
      ]
    },
    "maxNumConcurrentSubTasks": 35,
    "totalNumMergeTasks": 100
  }
}
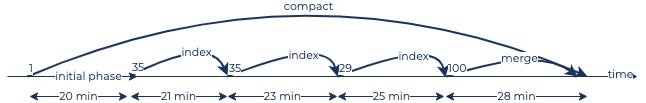
Figure 4. Number/duration/type of tasks of a sample compaction task
What’s next?
The famous writer E.M. Forster once said “A work of art is never finished…”. Given the increased scale of operation on our Druid deployment, we are always looking at ways to improve the architecture and scalability of the entire telemetry pipeline. Some of our future work may include:
- Automating deployments using Druid Operator
- Enabling distributed tracing in all Druid services for better diagnostics/debugging
- Looking beyond metrics and onboarding new use cases like events, traces, etc.
- Replacing MiddleManagers with Indexers for better resource utilization
Our North Star vision is to automate all of our Druid deployments using a one-click solution and make Druid completely self-service internally within Confluent to support a variety of use cases. And, we are striding toward this vision while continuing to power cloud-scale analytics!
If you are passionate about building highly complex distributed systems with interesting scale challenges, check out Confluent’s current career openings. If you’d like to try Confluent Cloud for yourself, sign up for a free trial and use the code CL60BLOG to get an additional $60 of free usage.*
Ist dieser Blog-Beitrag interessant? Jetzt teilen
Confluent-Blog abonnieren


Customer Intelligence Hub: A Single Pane of Glass for Customer Insight and Action
Customer Intelligence Hub unifies customer signals into a real-time, AI-powered view that helps GTM teams prioritize risk, identify opportunity, and act faster with contextual insights.