Neu in Confluent Cloud: Daten & Pipelines für KI-fähiges Streaming zugänglich machen | Mehr erfahren
Bounding ksqlDB Memory Usage
It’s important to be able to limit memory consumption of a running service. Use too much, and your application will crash and need to restart. If this happens too often, your service is in danger of missing its SLA.
Limiting memory usage has been a common point of friction for ksqlDB users. This blog post deep dives into how we make sure ksqlDB respects memory usage limits in Confluent Cloud. We’ll start with a discussion of how we configure memory limits, then move into an investigation of a real-world scenario where this bound is not honored. Finally, we’ll look at how we fixed this problem in Confluent Cloud and show you how to fix this in your own deployments.
Bounding ksqlDB memory usage
ksqlDB primarily consumes memory allocated by the JVM for its heap and by directly allocating so-called “off-heap” memory using the native allocator. The JVM heap is used for all the allocations made in the JVM. The main consumer of off-heap memory is RocksDB. ksqlDB uses RocksDB to store state for computing aggregates and joins. RocksDB mostly allocates memory for buffering incoming writes, storing its index, and for caching data for reads.
Without precise configuration, the memory used by RocksDB can grow without bound as we add more queries and process more data. This is largely because ksqlDB creates one or more new RocksDB instances to store the state for each stateful task in a query (I won’t go into why, but I’ll give you a hint: Tasks map very closely to the underlying topic partitions). ksqlDB implements its own RocksDBConfigSetter to configure RocksDB to limit memory across all instances. The config setter, called KsqlBoundedMemoryRocksDBConfigSetter, works by:
- Running all RocksDBs with a shared cache with a configurable upper bound on size. This bounds the total size of cached data blocks.
- Configuring RocksDB to use the cache for storing index and bloom filter blocks. This bounds the in-memory size of the index by using the cache for index data.
- Running all RocksDBs with a shared write buffer manager. The write buffer manager enforces a bound on the total size of write buffers across all RocksDB instances.
ksqlDB uses these three techniques to bound RocksDB memory usage across all RocksDB instances. Along with setting the JVM heap size, this should bound the memory consumed by ksqlDB. In Confluent Cloud, we typically limit the JVM and RocksDB to 12 GB out of an available 30 GB, and leave the rest to the buffer cache in the kernel to cache compressed RocksDB blocks.
Real-world experience
Of course, in the real world, things never work quite how we imagine they will. 🙂 In our first few months running ksqlDB in Confluent Cloud, we observed occasional long-lived jumps in memory usage well past the configured limits. For example, consider the following chart, which tracks memory usage (docker.mem.rss) and buffer cache usage (docker.mem.cache) of a Confluent Cloud ksqlDB cluster:
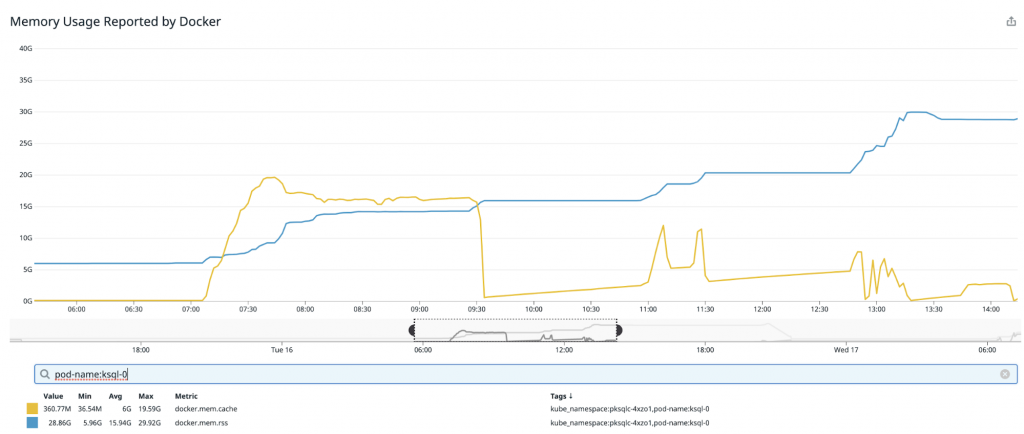
Initially, usage is capped where we would expect (a little over our configured bound at ~14 GB) but soon jumps permanently to ~16 GB, then to ~20 GB, and eventually to ~28 GB—well past the desired limits. Left to continue to grow, this node would most likely crash. In the rest of this blog post, we’ll go through our investigation, conclusions, and solution to this problem in the immediate and longer term.
Investigation
Our initial investigation was mostly unfruitful. We knew that the usage must be coming from off-heap allocations since the JVM heap size was limited to the configured bounds. The only other diagnostic available was a memory map report generated using the Linux utility pmap, which showed a large number of ~64 MB mostly resident anonymous (meaning that the mapping is not mapped to an actual file) mappings that accounted for most of the usage. However, it was not clear what code path had allocated those regions.
Lacking sufficient information, our strategy was to try to consistently reproduce the problem. This way, we could reproduce it while using an allocator that includes a profiler to see what codepath(s) were allocating the mystery buffers.
Reproducing memory growth
To reproduce the problem, we tested various scenarios based on observed instances of unbounded memory growth, including running with different query types, a high partition count, and forcing queries to exit on error and then restarting them. Ultimately, we found a very simple and reliable way to reproduce the behavior: Start a query that stores a lot of data against a source backed by a single partition topic. In our test case, we computed a LATEST_BY_OFFSET aggregation on a data source with 1 million keys and 5 KB records. Then, allow the query to run until ksqlDB hits the configured memory bound (12 GB), terminate the query, and then start a new query. This procedure can be repeated to cause higher and higher usage. The result can be seen in the following chart (again, tracking memory and cache usage):
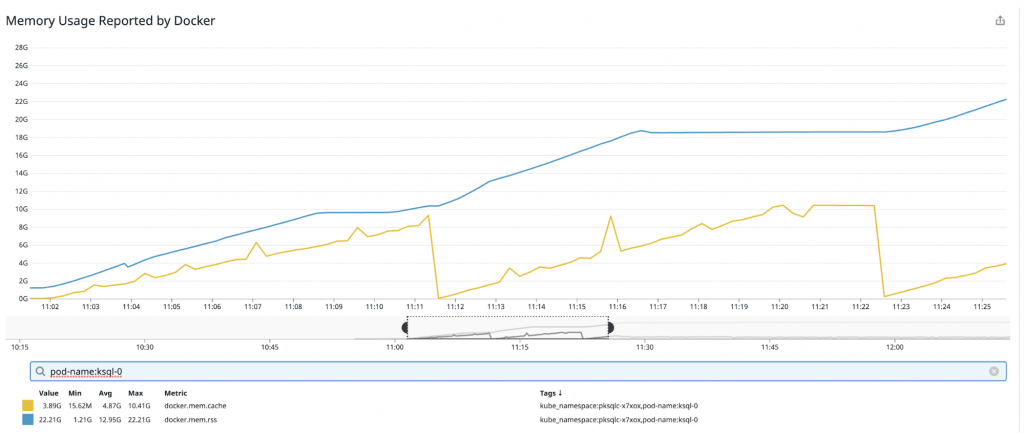
We start the test by running a single query. Then, at ~11:11:00 when usage levels off, we stop the query and start a new one at which point usage begins growing again. Similarly, once usage again levels off at ~11:21:00, we again stop the query and start a new query and observe the same growth pattern.
Profiling memory usage
At this point, we suspected that for some reason memory used by terminated queries was not being released when it’s eventually evicted from RocksDB’s cache.
To support this, we tried running ksqlDB using memory allocators (basically, C libraries implementing malloc and free) that support allocation profiling, like TCMalloc and jemalloc. When profiling is enabled, these allocators internally track code paths that allocate and free virtual address space via calls to malloc and free (and optionally mmap and munmap) to help identify likely culprits of unexpected usage or unfreed memory.
Running with an alternative allocator is quite easy on Unix systems. Simply install the allocator and start the server with the `LD_PRELOAD` environment variable set to the profiler- shared library. For example, use this to run with jemalloc on Debian:
$ apt install -y libjemalloc-dev
$ LD_PRELOAD="/usr/lib/x86_64-linux-gnu/libjemalloc.so” /usr/bin/ksql-server-start
Excited to finally get to the bottom of our mysterious memory growth problem, we set up our test environment to run ksqlDB with jemalloc and ran through our super reliable, memory-growth-reproducing test case.
And of course—memory usage nicely flattened out at the configured limit. Confused, we tried the same experiment with TCMalloc and observed the same behavior: no excess memory growth.
Digging into glibc malloc
On the one hand, it was nice to have a possible solution to our problem—just swap the allocator. On the other hand, it was unsatisfying to lack a deeper understanding of what was going on.
To investigate further, we instrumented ksqlDB to log the output of `malloc_info` whenever a query is stopped or started. The malloc_info function writes an XML-formatted description of the glibc allocator’s internal state. Initially, we suspected fragmentation and wanted to know whether glibc was retaining (but not returning to the OS) memory that the application had freed. This is described in the total heap summary returned in the description. Let’s look at an example for one of our test runs after two terminate-stop iterations:
The line system type="current" size="19407069184” describes the current heap size (19 GB), while the lines total type="fast" count="187821" size="18019088" and total type="rest" count="209923" size="12920548467" describe the size of chunks that the allocator is holding internally to hand to callers of malloc. This tells us most of the process’s memory is indeed in the free lists internal to the allocator.
Understanding why this happens (it turns out that it’s not really fragmentation) and is particularly dramatic for ksqlDB requires a bit of background on glibc’s malloc implementation. I’ll summarize the important points here:
- malloc maintains memory in collections called arenas.
- An arena is composed of heaps, which are blocks of memory that are mmapped (or in the case of the first arena, created by extending the process’s heap). Each heap belongs to one arena.
- malloc tries to maintain a many:1 mapping between threads and arenas to minimize contention.
- Arenas aren’t shrunk or unmapped until there is enough contiguous free space at the end of the arena.
Now let’s consider what happens when we do the following:
- Start query A (with one thread)
- Terminate the query
- Start query B (with one thread)
Query A allocates buffers as it reads and writes from RocksDB. Most of these are pretty short lived, except for the ones that it puts in the RocksDB cache. Over time, query A fills up RocksDB’s cache, and all the allocations are made against one arena. Let’s call it arena A.
Now, suppose query A is terminated. The data is not immediately freed because the cache is shared across all RocksDBs.
Query B is started. It starts evicting blocks from the cache and filling the cache with its own blocks. Its blocks are most likely allocated from a different arena, say arena B. The blocks evicted from the cache are freed, but there’s probably not enough contiguous space in arena A to unmap the memory, so it’s never released back to the OS.
This theory is substantiated by looking at the arenas in our log.
After the first terminate-start iteration, here are the relevant bits of our malloc_info log:
...
<heap nr="15"> (1)
<sizes>
...
</sizes>
<total type="fast" count="37" size="2832"/>
<total type="rest" count="57594" size="46287993"/>
<system type="current" size="6456401920"/>
<system type="max" size="6483668992"/>
<aspace type="total" size="6456401920"/>
<aspace type="mprotect" size="6456401920"/>
<aspace type="subheaps" size="97"/>
</heap>
...
<total type="fast" count="4340" size="274096"/>
<total type="rest" count="59098" size="155128826"/> (2)
<total type="mmap" count="24" size="81727488"/>
<system type="current" size="6617870336"/> (3)
<system type="max" size="6707470336"/>
<aspace type="total" size="6617870336"/>
<aspace type="mprotect" size="6680203264"/>
</malloc>
We can see that the current size of arena 15 (1) is 6 GB (3) and that the size of the free blocks is relatively small (~147 MB) (2), meaning that it’s mostly allocated to the running program. Now, let’s look at malloc’s state after the next terminate-start:
... <heap nr="15"> (1) <sizes> ... </sizes> <total type="fast" count="58194" size="5587152"/> <total type="rest" count="133622" size="6428090181"/> (2) <system type="current" size="6456401920"/> (3) <system type="max" size="6483668992"/> <aspace type="total" size="6456401920"/> <aspace type="mprotect" size="6456401920"/> <aspace type="subheaps" size="97"/> </heap> ... <heap nr="27"> (4) <sizes> ... </sizes> <total type="fast" count="0" size="0"/> <total type="rest" count="26911" size="36315374"/> (5) <system type="current" size="6427738112"/> (6) <system type="max" size="6447505408"/> <aspace type="total" size="6427738112"/> <aspace type="mprotect" size="6447505408"/> <aspace type="subheaps" size="97"/> </heap> ... <total type="fast" count="58726" size="5627840"/> <total type="rest" count="161913" size="6640501049"/> <total type="mmap" count="25" size="98508800"/> <system type="current" size="13102596096"/> (7) <system type="max" size="13204541440"/> <aspace type="total" size="13102596096"/> <aspace type="mprotect" size="13177274368"/> </malloc>
After this iteration, we see that ~12 GB of memory are used (7). Arena 15 is still roughly the same size (3), but it is mostly filled with freed blocks (2). And now arena 27 (4) has grown to 6 GB (6) and is mostly used (5). Finally, let’s look after the last iteration:
...
<heap nr="6">
<sizes>
<size from="17" to="32" total="736" count="23"/>
<size from="33" to="48" total="528" count="11"/>
<size from="49" to="64" total="704" count="11"/>
<size from="65" to="80" total="1680" count="21"/>
<size from="81" to="96" total="576" count="6"/>
<size from="97" to="112" total="784" count="7"/>
<size from="113" to="128" total="2304" count="18"/>
<size from="33" to="33" total="261888" count="7936"/>
<size from="49" to="49" total="241129" count="4921"/>
<size from="65" to="65" total="227370" count="3498"/>
<size from="81" to="81" total="189783" count="2343"/>
<size from="97" to="97" total="3298" count="34"/>
<size from="1633" to="1633" total="1633" count="1"/>
<size from="3041" to="3041" total="3041" count="1"/>
<size from="20305" to="20465" total="183801" count="9"/>
<size from="20481" to="22689" total="9894334" count="462"/>
<size from="43345" to="65265" total="1224267" count="27"/>
<size from="109457" to="130689" total="717702" count="6"/>
<size from="131457" to="153009" total="415923" count="3"/>
<size from="1293537" to="4194337" total="11779381" count="5"/>
<unsorted from="49" to="139345" total="402301" count="221"/>
</sizes>
<total type="fast" count="97" size="7312"/>
<total type="rest" count="19468" size="27777787"/>
<system type="current" size="6419025920"/>
<system type="max" size="6433574912"/>
<aspace type="total" size="6419025920"/>
<aspace type="mprotect" size="6433574912"/>
<aspace type="subheaps" size="97"/>
</heap>
...
<heap nr="15">
<sizes>
...
</sizes>
<total type="fast" count="1" size="64"/>
<total type="rest" count="57568" size="6434429839"/>
<system type="current" size="6446510080"/>
<system type="max" size="6483668992"/>
<aspace type="total" size="6446510080"/>
<aspace type="mprotect" size="6456401920"/>
<aspace type="subheaps" size="97"/>
</heap>
...
<heap nr="27">
<sizes>
...
</sizes>
<total type="fast" count="2" size="192"/>
<total type="rest" count="71908" size="6394880243"/>
<system type="current" size="6412144640"/>
<system type="max" size="6447505408"/>
<aspace type="total" size="6412144640"/>
<aspace type="mprotect" size="6447505408"/>
<aspace type="subheaps" size="97"/>
</heap>
...
<total type="fast" count="2125" size="139488"/>
<total type="rest" count="150520" size="13021307384"/>
<total type="mmap" count="25" size="98508800"/>
<system type="current" size="19493326848"/>
<system type="max" size="19640348672"/>
<aspace type="total" size="19493326848"/>
<aspace type="mprotect" size="19613081600"/>
</malloc>
Now arenas 15 and 27 are mostly free but still very large at around 6 GB, and arena 6 has grown to 6 GB and is mostly in use.
So the hypothesis holds up—each query starts a new thread, and it allocates memory from a new arena. The data used by the terminated query is freed, but it’s freed to a different arena that is not actually unmapped until a sufficiently large region at its end is completely unused.
The astute reader might wonder why this issue isn’t more common. We think that the conditions required to trigger it are actually fairly unique to ksqlDB. Specifically, the application needs to:
- Create enough threads to trigger the creation of many different arenas. The JVM itself creates lots of threads. ksqlDB adds many more long-running threads before starting a single query. These include Kafka client threads, the web server thread pool, and a few internal daemon threads.
- Consecutively run long-lived threads that each allocate and free lots of memory. Currently, each ksqlDB query is executed on its own thread(s).
We were able to write a simple C program that exhibits the same unbounded growth by doing the above.
Follow-up work
For the immediate term, we concluded that ksqlDB’s current pattern of allocating a new thread pool per query does not play nicely with glibc. We decided to switch our allocator implementation to jemalloc using the LD_PRELOAD trick demonstrated above.
Longer term, we will likely rethink ksqlDB’s runtime architecture to use a common thread pool for processing records across multiple queries. This has benefits far beyond improving allocator efficiency but should help here as well.
Recommendations
I’d like to conclude with some general recommendations for bounding memory usage with ksqlDB. In particular, we recommend you do the following:
- Run ksqlDB with KsqlBoundedMemoryRocksDBConfigSetter to configure a bound on usage across all RocksDB instances. Determining the exact bound will depend on your specific system and queries. Reserving 25% of available memory for RocksDB may be a good starting point. To configure ksqlDB with the config setter and have it adhere to a given bound, set the following properties in your server properties file:
ksql.streams.rocksdb.config.setter=io.confluent.ksql.rocksdb.KsqlBoundedMemoryRocksDBConfigSetter
ksql.plugins.rocksdb.cache.size=<desired memory bound>
ksql.plugins.rocksdb.write.buffer.cache.use=true
ksql.plugins.rocksdb.num.background.threads=<number of cores>
- Run ksqlDB with jemalloc using the LD_PRELOAD technique shown above, especially if you expect to stop and start queries frequently.
Summary
We’ve learned how you can make sure your ksqlDB server adheres to your desired limits on memory usage. A great first step here is to configure your deployment to use KsqlBoundedMemoryRocksDBConfigSetter. However, as we’ve seen, if you are running on Linux and expect to frequently stop and start queries, you may also need to configure ksqlDB to use a different allocator, like jemalloc.
I hope this post has helped you learn a bit more about how to run ksqlDB successfully while also giving you some insight into the work we’re doing to make it an awesome event streaming database. If you’d like to contribute or stay up to date on what’s coming down the road, please check out our open issues and design proposals.
Ready to check ksqlDB out? Head over to ksqldb.io to get started, where you can follow the quick start, read the docs, and learn more!
Ist dieser Blog-Beitrag interessant? Jetzt teilen
Confluent-Blog abonnieren


Why ELT Can't Keep Up in the Era of High-Scale Data Engineering
Batch ELT pipelines create duplication, cost spikes, and governance gaps as data scales. Here’s why enterprises are rethinking legacy integration models.


How to Protect PII in Apache Kafka® With Schema Registry and Data Contracts
Protect sensitive data with Data Contracts using Confluent Schema Registry.