Ahorra un 25 % (o incluso más) en tus costes de Kafka | Acepta el reto del ahorro con Kafka de Confluent
Fault Tolerance in Distributed Systems: Tracing with Apache Kafka and Jaeger
Using Jaeger tracing, I’ve been able to answer an important question that nearly every Apache Kafka® project that I’ve worked on posed: how is data flowing through my distributed system?
Quick disclaimer: if you’re simply looking for an answer to that question, this post won’t provide that answer directly. Instead, in this post I will point you to an earlier blog post where I already answered that question and then I will focus on what should be your next question: now that I’m relying on Jaeger to trace how data is flowing through my distributed system, what if Jaeger goes down?
Disclaimer aside, if you follow along, you’ll have all the information you need to start tracing data in your Kafka project with Jaeger and learn how you can use Kafka to make your Jaeger tracing solution more robust. Eventually, this GitHub repository will come in handy.
Distributed tracing with Apache Kafka and Jaeger
Before I discuss how Kafka can make a Jaeger tracing solution in a distributed system more robust, I’d like to start by providing some context.
In an earlier blog post that I wrote for Object Partners, a Confluent partner, I outlined why it can be a challenge to illustrate exactly how data flows through a distributed system and demonstrated how Jaeger is up for that challenge. While I encourage you to read the entire post, here are the big takeaways:
- It is difficult to show data flowing through a distributed system that uses Apache Kafka because Kafka decouples consumers and producers, meaning applications do not directly communicate with each other.
- Although it is difficult, it is doable thanks to distributed tracing tools such as Jaeger and OpenTracing.
- To accomplish this, OpenTracing Kafka instrumentation passes Jaeger correlation information in the Kafka message headers. But even after configuring Jaeger, you may need to update the consumer application code as well to ensure that the correlated information is appropriately propagated whenever the application produces new Kafka messages.
- The source code for the example project that was configured in my earlier blog post is available on GitHub.
What does this all mean? It means that the previous blog post already provides the information needed to start seeing traces like this in Jaeger:
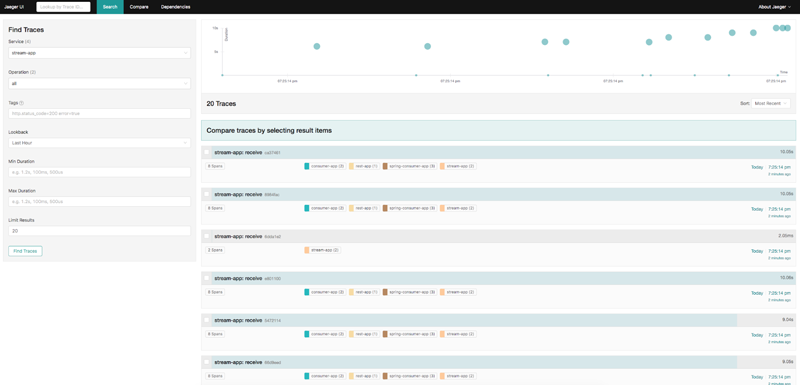
It also means this post has a working example project to start from in order to answer the next question: what if Jaeger goes down?
Example of a Kafka project with Jaeger tracing
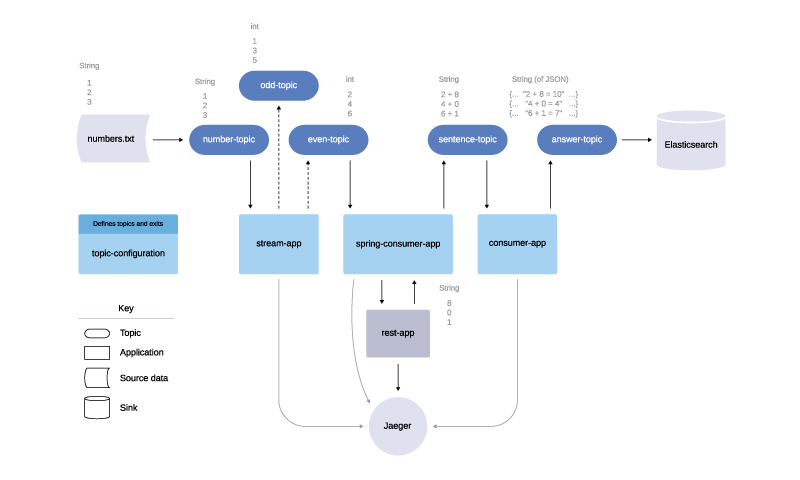
Initial tracing example of the Kafka project design
The example project, diagrammed above, consists of five standalone Spring Boot applications. One of the applications (topic-configuration) simply configures all of the Kafka topics and exits upon completion. Another (rest-app) defines an HTTP endpoint that will respond with a random number, and the other three (stream-app, spring-consumer-app, and consumer-app) all consume and produce messages with Kafka.
Ultimately what this project accomplishes is arbitrary. Given a text file of numbers, it will take each even number, add a random number to it, and produce sentence messages like: 6 + 1 = 7, where 6 is the initial input number from the text file. The important part, for the purposes of demonstrating distributed tracing with Kafka and Jaeger, is that the example project makes use of Kafka Streams (in the stream-app), a Kafka consumer/producer (in the consumer-app), and a Spring Kafka consumer/producer (in the spring-consumer-app). In this way, it is a perfect example project to start with.
What if Jaeger goes down?
The example diagram also illustrates a dependency on Jaeger. All four of the Spring Boot applications that produce spans making up the trace in the Jaeger output screenshot above communicate with Jaeger directly.
So what if Jaeger goes down? The way I see it, that would result in two potential problems:
- If there is no persistence layer for the tracing information, past traces are lost forever.
- When Jaeger is healthy again, even if I add a persistence layer, I don’t have any tracing insight into what happened in the distributed system during the Jaeger downtime.
Fault Tolerance with Kafka
If each application sent spans to a Kafka topic instead of to Jaeger directly, and then only one application attempted to send those spans to Jaeger, I’d solve both potential problems:
- The tracing information would not be lost, as it would live on the Kafka topic for the retention.ms time period even if Jaeger goes down. Plus, if I wanted it to live on indefinitely, I could easily offload the data in that topic to some cheap storage using a Kafka connector.
- During the Jaeger downtime, each application would still be able to send spans to the Kafka topic, so when Jaeger is healthy again, I still have continuous tracing insight.
In addition, if this were a multi-clustered production system and not just a single-clustered, local demo, I’d have the flexibility to separate my applications from the fault-tolerant Jaeger layer. Nonetheless, here is what this example project looks like in an updated diagram.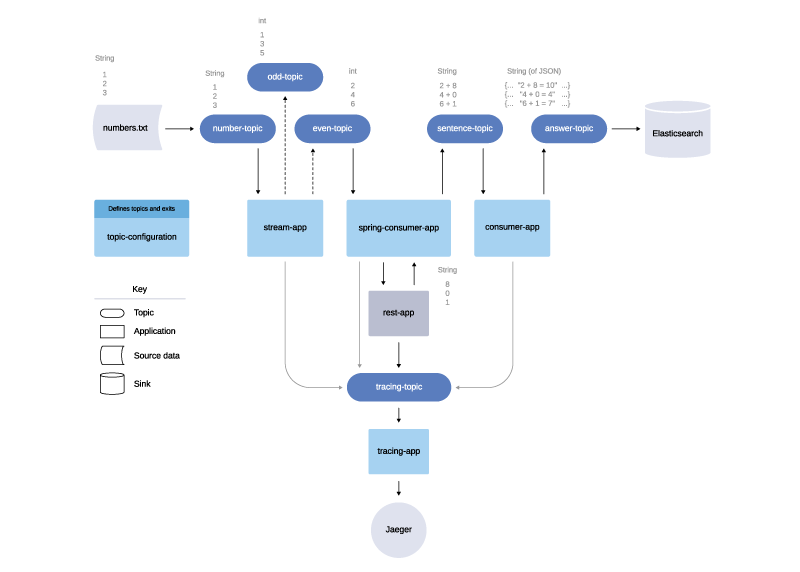
Fault-tolerant tracing example of the Kafka project design
You can also find the example project on GitHub to follow along as I outline the implementation.
Implementation: Send spans to a Kafka topic instead of to Jaeger
In order to start sending the spans to a Kafka topic instead of to Jaeger directly, I needed to make changes to the configuration of the OpenTracing tracer. Take a look at the class com.github.burkaa01.stream.config.tracing.TracingConfig in the stream-app for an example of this. The key difference in the configuration is that where I would have otherwise done something like this:
.withSender(
  io.jaegertracing.Configuration.SenderConfiguration.fromEnv()
    .withAgentHost(jaegerHost)
    .withAgentPort(jaegerPort)
))
I instead referred to my extension of the Jaeger tracing SenderConfiguration, com.github.burkaa01.stream.config.tracing.KafkaSenderConfiguration, like this:
.withSender(
  new KafkaSenderConfiguration(bootstrapServers, tracingTopic)
))
Here is the entire tracer bean definition where I configure the sampler and the reporter for tracing. The withReporter below defines what to do when a span gets reported, but it only gets triggered after the configured withSampler decides that the span should be sampled. The withType(ConstSampler.TYPE).withParam(1) means to sample all traces so we won’t miss a thing:
@Bean
public Tracer tracer() {
  return io.jaegertracing.Configuration.fromEnv(applicationName)
      .withSampler(
          io.jaegertracing.Configuration.SamplerConfiguration.fromEnv()
              .withType(ConstSampler.TYPE)
              .withParam(1))
      .withReporter(
          io.jaegertracing.Configuration.ReporterConfiguration.fromEnv()
              .withLogSpans(true)
              .withFlushInterval(1000)
              .withMaxQueueSize(10000)
              .withSender(
                  new KafkaSenderConfiguration(bootstrapServers, tracingTopic)
              ))
      .getTracer();
}
When the application is looking for an instance of the Jaeger ThriftSender to send spans to Jaeger, it will get my implementation of a ThriftSender (com.github.burkaa01.stream.config.tracing.KafkaSender) because of the @Override of getSender in the KafkaSenderConfiguration.
The only difference between the KafkaSender and any other Jaeger provided ThriftSender is that rather than sending messages to Jaeger directly, the KafkaSender takes the span batch bytes and produces a message to the Kafka topic: tracing-topic. In other words, where the UdpSender would have sent spans to the jaeger-agent over UDP or where the HttpSender would have sent spans directly to the jaeger-collector, the KafkaSender simply produces a message to a Kafka topic. It does so by overriding the abstract ThriftSender method send like this:
@Override
public void send(Process process, List spans) throws SenderException {
  Batch batch = new Batch(process, spans);
  byte[] bytes;
  try {
    bytes = serialize(batch);
  } catch (Exception e) {
    throw new SenderException(String.format("Failed to serialize %d spans", spans.size()), e, spans.size());
  }
  if (bytes != null) {
    ProducerRecord<String, byte[]> record = new ProducerRecord<>(topic, bytes);
    producer.send(record, (RecordMetadata recordMetadata, Exception exception) -> {
      if (exception != null) {
        LOGGER.error(String.format("Could not send %d spans", spans.size()), exception);
      }
    });
  }
}
To close the producer, it overrides the abstract ThriftSender method close like this:
@Override
public int close() throws SenderException {
  try {
    return super.close();
  } finally {
    producer.close();
  }
}
After each application was configured to send the spans to the tracing-topic Kafka topic instead of to Jaeger directly, I needed to create one more standalone Spring Boot application, the tracing-app, that consumed from that topic.
Implementation: Consume messages from the Kafka topic and send them to Jaeger
The two classes of interest in the tracing-app are com.github.burkaa01.tracing.tracing.TracingConsumer and com.github.burkaa01.tracing.tracing.JaegerHttpSender. The TracingConsumer uses the @KafkaListener annotation to consume messages from the tracing-topic topic. Then, it passes the message value byte array to the JaegerHttpSender. The JaegerHttpSender then sends the span data to the jaeger-collector, much like the Jaeger tracing implementation of io.jaegertracing.thrift.internal.senders.HttpSender does.
For a fault-tolerant solution, the TracingConsumer must throw a RuntimeException whenever there is a problem with the JaegerHttpSender send and only ever acknowledge that it consumed the Kafka message after a completely successful invocation of the send method. In order to configure that behavior for the TracingConsumer, I added the following lines of code in com.github.burkaa01.tracing.config.TracingConsumerConfig:
factory.getContainerProperties().setAckMode(MANUAL);
factory.getContainerProperties().setErrorHandler(new SeekToCurrentErrorHandler());
I set the ack mode to manual and used Spring’s SeekToCurrentErrorHandler, because I don’t want to acknowledge successful consumption of the message upon failure and move on to the next available message. This is an extremely important offset management detail, especially if you are used to setting enable.auto.commit to true for your Kafka consumers. In this case, when the ack mode is manual and enable.auto.commit is false, the consumer is not automatically committing message offsets as it consumes messages.
If it were, it might commit an offset for a message at an interval before the application has entirely processed the message. Then, if the application fails to send the span data from one message to Jaeger, and the consumer reads the next message relative to the most recently committed offset, it will pass over the message it failed to process. For this use case, we want the consumer to re-consume the message for any given offset over and over until we acknowledge manually that the application is completely done with it, and it is okay to commit the offset.
I should also mention that the TracingConsumer sleeps between failed attempts to consume and send messages to Jaeger. The sleep for an arbitrary amount of time (20 seconds in this case) makes for a cleaner log output for demonstration purposes, because otherwise the consumer would consume and fail over and over very quickly during the simulated outage.
Demonstration: Distributed Tracing with Apache Kafka when Jaeger goes down
If you are following along on GitHub, you can run the following commands from the base directory of the project to start everything up:
docker-compose up -d
Now, notice in the docker-compose.yml that I am running Jaeger with the jaegertracing/all-in-one. This executable is perfect for little demonstrations and local testing, because it quickly launches the Jaeger UI, jaeger-collector, jaeger-query, and jaeger-agent with an in-memory storage component, all in one go. That said, come time for a production-ready solution, I would handle this differently. As such, in order to simulate a problem with sending span data to the jaeger-collector, I am actually going to do something much worse and take every Jaeger component down by running the following command:
Wait a moment, and then run the following commands:
cd ./kafka-connect/file-source
curl -X POST -H "Content-Type: application/json" --data @file-source.json http://localhost:8083/connectors
curl http://localhost:8083/connectors
cd ../elastic-sink
curl -X POST -H "Content-Type: application/json" --data @elastic-sink.json http://localhost:8083/connectors
curl http://localhost:8083/connectors
Wait another moment, and you’ll notice that data is flowing through the applications. However, Jaeger is not collecting that data, and it is not available at http://localhost:16686.
Take a look at the tracing-app logs by running the following command:
docker logs -f tracing-app
You will see output like the following over and over:
INFO  : sending 9 span(s) to jaeger
ERROR : could not send spans to jaeger, retrying offset 0, but first sleeping for 20 seconds
ERROR : Error handler threw an exception
The tracing-app is never consuming anything but offset 0, because it is failing to send our messages to Jaeger. When Jaeger is healthy again, it will be able to pick up all the messages exactly where we left off (in this case at the beginning) and, thus, we won’t lose any of our traces.
Now let’s bring back Jaeger by running the following command from the base directory of the project:
docker-compose up jaeger
Take a look at the tracing-app log output now:
INFO  : sending 9 span(s) to jaeger
INFO  : sending 100 span(s) to jaeger
INFO  : sending 1 span(s) to jaeger
You should see all of the traces in Jaeger at http://localhost:16686.
Closing thoughts
Unlike the initial Jaeger tracing solution I outlined in my earlier blog post, the fault-tolerant tracing solution with Kafka handles issues with an external dependency on Jaeger. Kafka was already the glue connecting everything in the distributed system example project, and now it is simply used to connect to Jaeger as well.
Jaeger already does a fantastic job of tracing the data as it flows through a distributed system, but by adding a layer of Apache Kafka in front of it, we get fault tolerance, storage, and replayability. That’s a big opportunity to add lots of value when introducing any new external dependency to a distributed system, not just Jaeger.
Interested in more?
If you’d like to learn more, you can sign up for Confluent Cloud, a fully managed event streaming platform powered by Apache Kafka, and use the promo code SPRING200 for an additional $200 of free Confluent Cloud usage.
¿Te ha gustado esta publicación? Compártela ahora
Suscríbete al blog de Confluent


