Ahorra un 25 % (o incluso más) en tus costes de Kafka | Acepta el reto del ahorro con Kafka de Confluent
Speed, Scale, Storage: Our Journey from Apache Kafka to Performance in Confluent Cloud
At Confluent, we focus on the holy trinity of performance, price, and availability, with the goal of delivering a similar performance envelope for all workloads across all supported cloud providers. In this blog post, we share our experience optimizing Apache Kafka® for Confluent Cloud.
We’ll cover our guiding principles that have led to incremental optimizations, as well as notable architectural improvements that have delivered large step-changes in performance.
First, we’ll discuss the three principles that have helped us with incremental optimizations to Confluent Cloud.
- The first principle is to know your users and plan for their workloads—it’s not a guessing game.
- The second principle focuses on why infrastructure matters. Optimization in the cloud is as much about cost as it is about performance. Know the infrastructure that you have available to you.
- The third principle underscores the importance of effective observability, without which no performance effort will succeed. You can’t improve what you don’t see.
After considering these principles, we’ll finish by focusing on architectural changes that have resulted in a step-change in performance. These changes have helped Confluent Cloud to achieve significant performance gains over self-managed Apache Kafka clusters.
If you’d like to learn more about how Kafka’s cloud-native capabilities were enhanced for Confluent Cloud, check out the other posts in the Design Considerations for Cloud-Native Data Systems Series:
- Introduction: Design Considerations for Cloud-Native Data Systems
- Part 1: Making Apache Kafka Serverless: Lessons From Confluent Cloud
- Part 3: From On-Prem to Cloud-Native: Multi-Tenancy in Confluent Cloud
- Part 4: Protecting Data Integrity in Confluent Cloud: Over 8 Trillion Messages Per Day
Principle 1: Know your users and plan for their workloads
The cloud is magical, but it’s not magical enough to handle the workload-specific tuning and optimization needed for high-efficiency systems. A large part of setting and achieving performance standards is understanding that workloads are varied and come with unique requirements. Performance optimization is a process that we have matured at Confluent Cloud. Our process starts with understanding the workload patterns, reproducing them, and feeding the results back to optimize our software, forming a tight feedback loop.
Performance is a group term that can mean many things. In the context of Apache Kafka, for example, it can refer to high throughput, low latency, or how quickly you can upgrade your broker software. We like to start by working backwards from our customers’ performance requirements and focus on the characteristics that make the biggest difference to their workloads. Typically, this is either where our customers identify the performance characteristics most important to them, or learnings from the data that we collect from our clusters, which allows us to prioritize the issues that could have the biggest impact on our Service-Level Objectives (SLOs).
Workload simulation, as the term states, is just simulation: an approximation of the real customer workloads we service every day. Even when using a relatively limited simulated dataset, workload simulation does offer valuable insight into the best and worst case performance for specific types of workloads.
By simulating such a use case, we are better equipped to understand the limits of our architecture, understand the limits of the cloud providers, and prioritize any features or improvements on our roadmap. At the heart of the simulation framework, we use Trogdor, an open source test framework that is purpose-built for Apache Kafka. The workload is described as a set of parameters in a JSON object, which is specified in a spec file.
{
  "class": "org.apache.kafka.trogdor.workload.ProduceBenchSpec",
  "durationMs": 10000000,
  "producerNode": "node0",
  "bootstrapServers": "localhost:9092",
  "targetMessagesPerSec": 10000,
  "maxMessages": 50000,
  "activeTopics": {
    "foo[1-3]": {
      "numPartitions": 10,
      "replicationFactor": 1
    }
  },
  "inactiveTopics": {
    "foo[4-5]": {
      "numPartitions": 10,
      "replicationFactor": 1
    }
  }
}
An example workload, simulating an Apache Kafka client that creates 5 topics of 10 partitions each, with a replication factor of 1, and then produces a total of 50,000 messages, at a rate of 10,000 messages per second, to 3 of the 5 topics. More examples can be found in the Apache Kafka repo.
Our simulation framework automates the generation and execution of these spec files through Trogdor, augments the runs with both server and client metrics during these runs, and validates against our throughput and latency SLOs for performance.
Performance envelope of Confluent Cloud
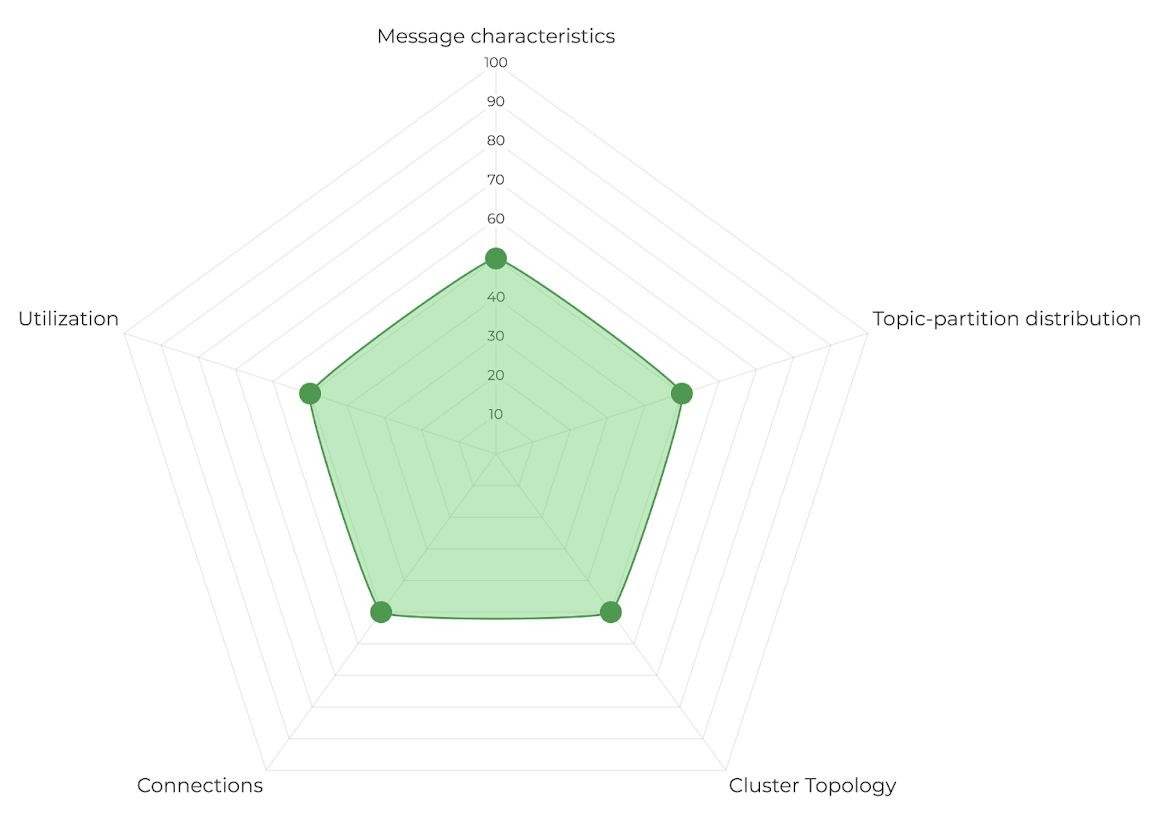
There are five workload characteristics that can be changed to optimize the performance envelope of Confluent Cloud.
- Message characteristics: Message characteristics include factors such as message size, number of requests, number of messages per request, request types, compression, etc., which affect throughput and latency. Depending on these characteristics, we see very different latencies for the same throughput.
- Topic-partition Distribution: This dimension focuses on the impact of workload distribution on a given topic-partition set. For low-throughput workloads, a large number of topic partitions is more resource-intensive compared to a smaller set of partitions.
- Cluster Topology: This dimension focuses on the overall impact of inter-broker replication to performance. Cluster size and resource utilization skews on brokers are key factors that can influence performance of a workload.
- Number of connections: This dimension focuses on the impact of connection rates and TLS on the performance of a workload.
- Utilization: This dimension focuses on the impact of asynchronous request pipelines on the performance of a workload. In general, this dimension focuses on the importance of building a feedback loop between the client and the server to ensure consistent performance.
Our fleet-wide performance metrics are specifically designed to help us understand our customer workloads from the perspective of each of these dimensions. Using these dimensions as our north star, we can better reason about bottlenecks reported or observed in production workloads, that are not necessarily reproduced easily in our simulated workloads.
Nightly Performance Tests
Workloads that help establish baseline performance for a Confluent Cloud cluster are promoted to run nightly, and are used to gate new releases. Our simulated workloads strive to test each of the workload characteristics with a relatively balanced focus. We actively monitor all failed runs for performance regressions. The framework tests the cluster end-to-end, including our load balancer fleet, and periodically profiles the cluster for diagnostic information.
In addition to looking at cluster performance during steady state, we benchmark performance in the presence of exceptional situations, like cluster upgrades, hardware replacement, and lagging consumers.
Reproducibility is key, and we track the commit, Kafka configuration, and system configuration for each run. We run our tests on every supported cloud and use the same framework for ad hoc performance investigations.
In addition, the historical profile data gathered for each run allows us to observe trends and focus on areas that could benefit from improvements. A good example of this is the continuous delivery of fetch API improvements over time.
Principle 2: Infrastructure matters
The cloud allows us to choose from a wide variety of instances with different CPUs, memory, and disks, and the only limit is our ability to benchmark new instances and disk types quickly enough. Our provisioning and pricing model allows us to switch between these instances without any impact on our users.
One of the goals of Confluent Cloud as a fully-managed service is to make capacity planning significantly easier. It takes considerable time and effort to validate expected performance across instances which are compute-optimized, memory-optimized, disk-optimized, ARM/X86. For a Confluent Cloud customer, capacity planning should only be about CKUs (Confluent Kafka Units), which are defined in terms of workload characteristics, such as the expected throughput and number of partitions; it should not be about picking the hardware that will support those workloads.
Hardware
When choosing the hardware for Confluent Cloud, we focus on the holy trinity of performance, price, and capacity, with the goal of delivering a similar performance envelope for all workloads across all supported cloud providers. We investigate new hardware as they become available, and we transparently upgrade clusters to use the hardware that can achieve our performance objectives most efficiently.
Efficiency is not just about being cost effective, but also about recognizing that there is no benefit to over-provisioning a resource that is not a bottleneck for the system to operate. For example, we ensured that the volumes attached to our brokers are sized to achieve the same throughput that we get from the network for the given instance size.
Running a large number of clusters has taught us to be wary of hardware availability. We track the time required to provision instances, and we avoid instance types that are capacity-constrained and can take more time to provision. As an additional safeguard against capacity issues, we have built the ability to switch hardware configurations for any cluster without downtime, falling back automatically to the machines with higher capacity.
OS
Building on top of this hardware is an equally critical piece of the infrastructure: the operating system. We follow best practices for configuring and tuning the Linux kernel, while keeping it up-to-date in order to benefit from continuous performance improvements and new feature rollouts. This practice made it relatively easy for us to experiment with the newer io_uring subsystem for asynchronous I/O, which reduces the overhead incurred from switching between the user-space and kernel-space.
This level of control over the operating system allows us to go beyond best practices and tune the environment to our use case. One example is the reduction in disk I/O operations per second, owing to better batching of page cache flushes; we achieved this by tuning the dirty_background_bytes and dirty_bytes. This allowed us to extract even more read and write throughput from the underlying storage hardware.
JVM
We finally get to the JVM, where the tunables are just as hard to get right, and be confident that they will hold up against all workloads. Our benchmarking suite and controlled rollouts help us identify and avoid performance regressions during upgrades. In addition to workload simulation and benchmarks, we have built the ability to make targeted configuration changes via feature flags. This has enabled us to run controlled fleetwide rollouts with well-tested rollback plans. With the help of these tools, we were able to confidently shrink the heap size of our clusters by 33%. We monitor Full GC time on all of our clusters, and heap dumps help us to locate the root causes of edge cases that can cause high memory allocation.
In addition to Kafka, we run other essential processes, including Apache ZooKeeper, metrics agents, and logging agents. We use our benchmarks to right-size resource allocation for these processes, ensuring that we can run them efficiently without compromising on performance. Right-sizing our ZooKeeper clusters helped us to achieve significant cost savings.
Principle 3: You can’t improve what you don’t see
To troubleshoot performance degradations, such as high latency, you need visibility into the hardware, the operating system, the JVM, and Kafka. Having the right observability metrics and logs helps us to identify and fix issues faster.
In Confluent Cloud, we run a health check probe that continuously reads and writes data to every cluster and monitors health check failures and latencies. We have a storage probe that attempts to write and flush a small amount of data to disk. We are introducing a network probe that attempts to establish TCP connections with the broker load balancer and detect network outages. These probes have helped to speed up both detection and remediation of performance issues, primarily because of the control they provide us compared to using telemetry from the customer workload. One example of this is probes that open up our ability to set monitors that are not subject to variances in the configuration of the clients. This helps us to triage connection issues relatively quickly.
Our monitoring platform collects metrics from all Kafka clusters on Confluent Cloud and stores it in our data stores. Our performance dashboard tracks latency and resource utilization goals across our clusters, and highlights the clusters that fail to meet these goals. We deep-dive into these clusters on a weekly basis to better understand workloads with high latency and high resource utilization. For faster diagnosis, our Kafka metrics dashboard has dedicated sections for health check, client, replication, network, log, controller, requests, consumer groups, transactions, metadata, and infrastructure (disk, CPU, memory). For general guidance and best practices on monitoring the various Kafka metrics, please refer to Monitoring Kafka Performance Metrics, on the Datadog blog.
In addition to metrics per cluster, we utilize Druid and BigQuery for fleet-wide analytics. This has helped us to tune configurations such as memory size, disk size, load-balancing thresholds, throttling thresholds, etc. We have self-balancing enabled on Confluent Cloud to continuously monitor resource utilization of our clusters and load-balance when necessary.
Our observability platform has played a key role in improving our understanding of performance bottlenecks in Kafka, and this has led to improvements in unexpected components. In one instance, our monitoring fleet alerted us about slow topic metadata requests on one of our Kafka clusters. On further investigation, we noticed that the pattern of usage on our multi-tenant clusters brought forth an inefficient algorithm for processing metadata requests from our clients. Profiling and request sampling were important here, since it was a particular type of metadata request. Maintaining an additional mapping of tenants to topics helped to reduce processing time by ~300x. For a more in-depth trace of the requests flowing through the brokers, we leverage frequent request sampling.
Performance is an operational concern
Every new cluster that comes to Confluent Cloud has a unique workload. To be able to do a good job with performance, we need to understand these workloads, especially the outliers. Restarting instances and adding capacity help to mitigate performance issues temporarily, but diving deeper has helped us to uncover memory bugs and performance regressions.
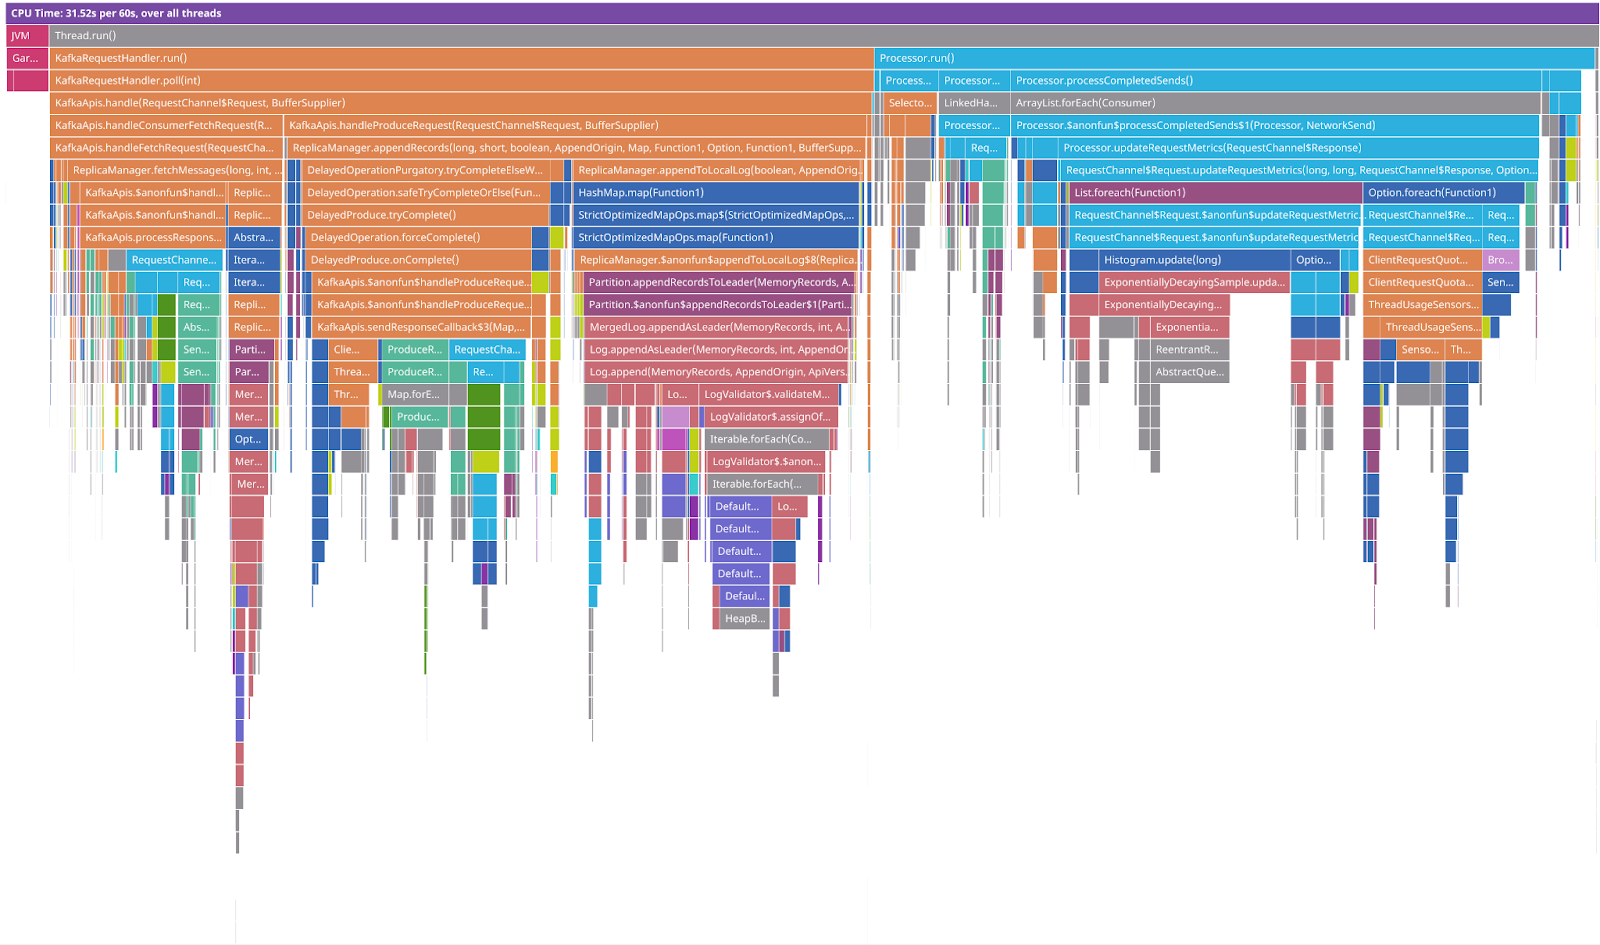
We utilize profiling tools and runbooks to better understand performance issues during incidents. We use the Async Profiler for profiling:
- CPU cycles
- Heap allocations
- Lock contention (including both Java object monitors and ReentrantLocks)
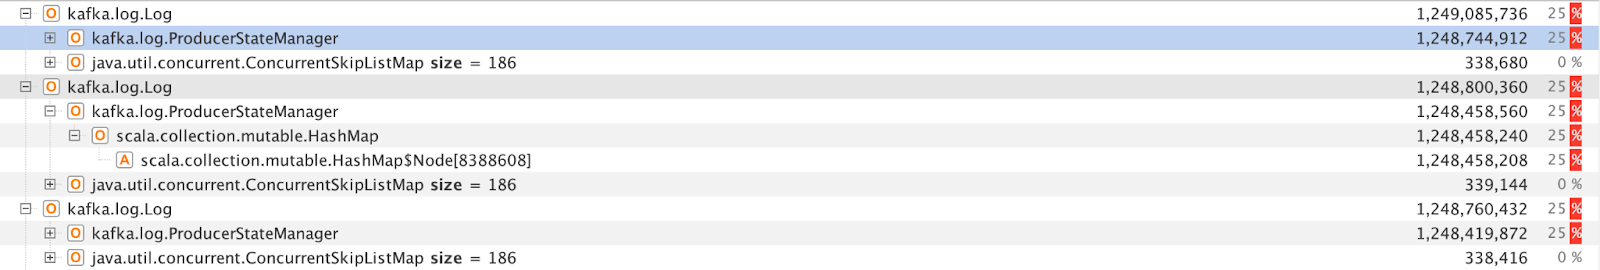
When troubleshooting high memory utilization, we use heap dumps for analyzing top consumers of memory. Analyzing a heap dump is slow, but it has helped us to better categorize issues and to prioritize fixing the ones that happen most often. For example, in recent troubleshooting, we discovered that maintaining producer append information led to high memory usage.
Notable architecture improvements
In this section, we would like to highlight architectural changes that have made a significant difference to performance in Confluent Cloud.
New storage engine
Project Metamorphosis brought Infinite Storage to Confluent Cloud through Tiered Storage. This decoupling of longer-term storage from the actual hardware hosting the Kafka brokers contributed to a number of performance benefits. With a smaller hotset on the disks attached to the Kafka brokers, clusters could now be expanded with CKUs much faster than before.
In addition, with a significantly smaller hotset stored locally on the brokers, it became economically feasible to use smaller, high-performance disks. Kafka’s write throughput can be no higher than the throughput of its storage devices, so choosing higher-throughput disks will lead to improved performance, up to the point where network bandwidth or CPU become the bottleneck. In addition, high-IOPS storage improves log flushing times. Since log flushing is done while holding a write lock on the partition being flushed, high-IOPS disks can significantly lower the tail latency of producer workloads.
An additional performance benefit of Tiered Storage is the separation of historical reads from real-time traffic. Before Tiered Storage was introduced, reading historical data created a high-IOPS workload on the same disks that producers were writing to, and this led to increased latency for produce workloads—which are typically real-time and require very low latencies. In addition, these historical reads were loaded into the Linux page cache, evicting more recent data and forcing more consumers to read from disk, which caused even more I/O contention. With Tiered Storage, historical reads do not use local disk, but rather object stores such as Amazon S3. As a result, they do not compete for I/O with producer workloads, and since historical data is read via network drivers, they do not use the file system page cache and do not evict more recent data. This means that latency-sensitive real-time traffic is isolated from high-throughput historical reads, leading to better multi-tenancy and more consistent latency.
Java SSL improvements
One of the key customer workload dimensions that we focused on was improving connection service times and reducing CPU load generated by client connections. Support for both high connection count (and therefore a larger number of clients) and high connection rate were frequently requested by our users—and therefore features worth investing in.
Confluent Cloud only uses TLS-encrypted connections for all customers. The connection handshake process is heavily influenced by the efficiency of the TLS stack. The Apache Kafka broker relies on the SSL stack in the JDK to service these connections, and the JDK SSL stack has seen significant improvements starting in JDK 9. In Confluent Cloud, these brought a significant improvement to the quality of service, in addition to lower CPU utilization on our Kafka clusters.
This gain is critical for heavily-loaded clusters during broker upgrades. A typical upgrade process migrates leader partitions off of a given broker to the other brokers while the original broker is replaced with a newer Kafka image. This, coupled with clients having to reconnect to the new broker for these partitions, requires significantly more burstable CPU on the target broker. Thus, any CPU headroom gained from these improvements is critical to making this process quick and seamless.
Upgrade cycle improvements
At Confluent Cloud, we strive to achieve faster continuous delivery of new improvements and features across the stack. Accelerating this process allows us to keep our clusters up-to-date and secure with faster roll-out of security patches. In addition, quicker iterations on newer features or infrastructure changes, such as new instance types, has become more viable because of our automated simulation framework.
We made a significant investment in improving the overall Kafka broker restart process to ensure a seamless upgrade process. For example, lazy loading of indexes and skipping sanity checks for segments below the recovery point enabled a faster broker startup. In addition, thanks to improvements in locking and the handling of the leader epoch cache files, Confluent Cloud benefits from a 3x reduction in time taken to gracefully shut down a Kafka broker.
With a faster upgrade cycle, we have the luxury of quickly adopting new features and performance improvements. One example of this was the recurring JVM upgrades to our Kafka clusters; these led to a flurry of performance improvements, including but not limited to a faster G1 GC that supported a multi-threaded Full GC. This contributed to lower tail latencies across the board.
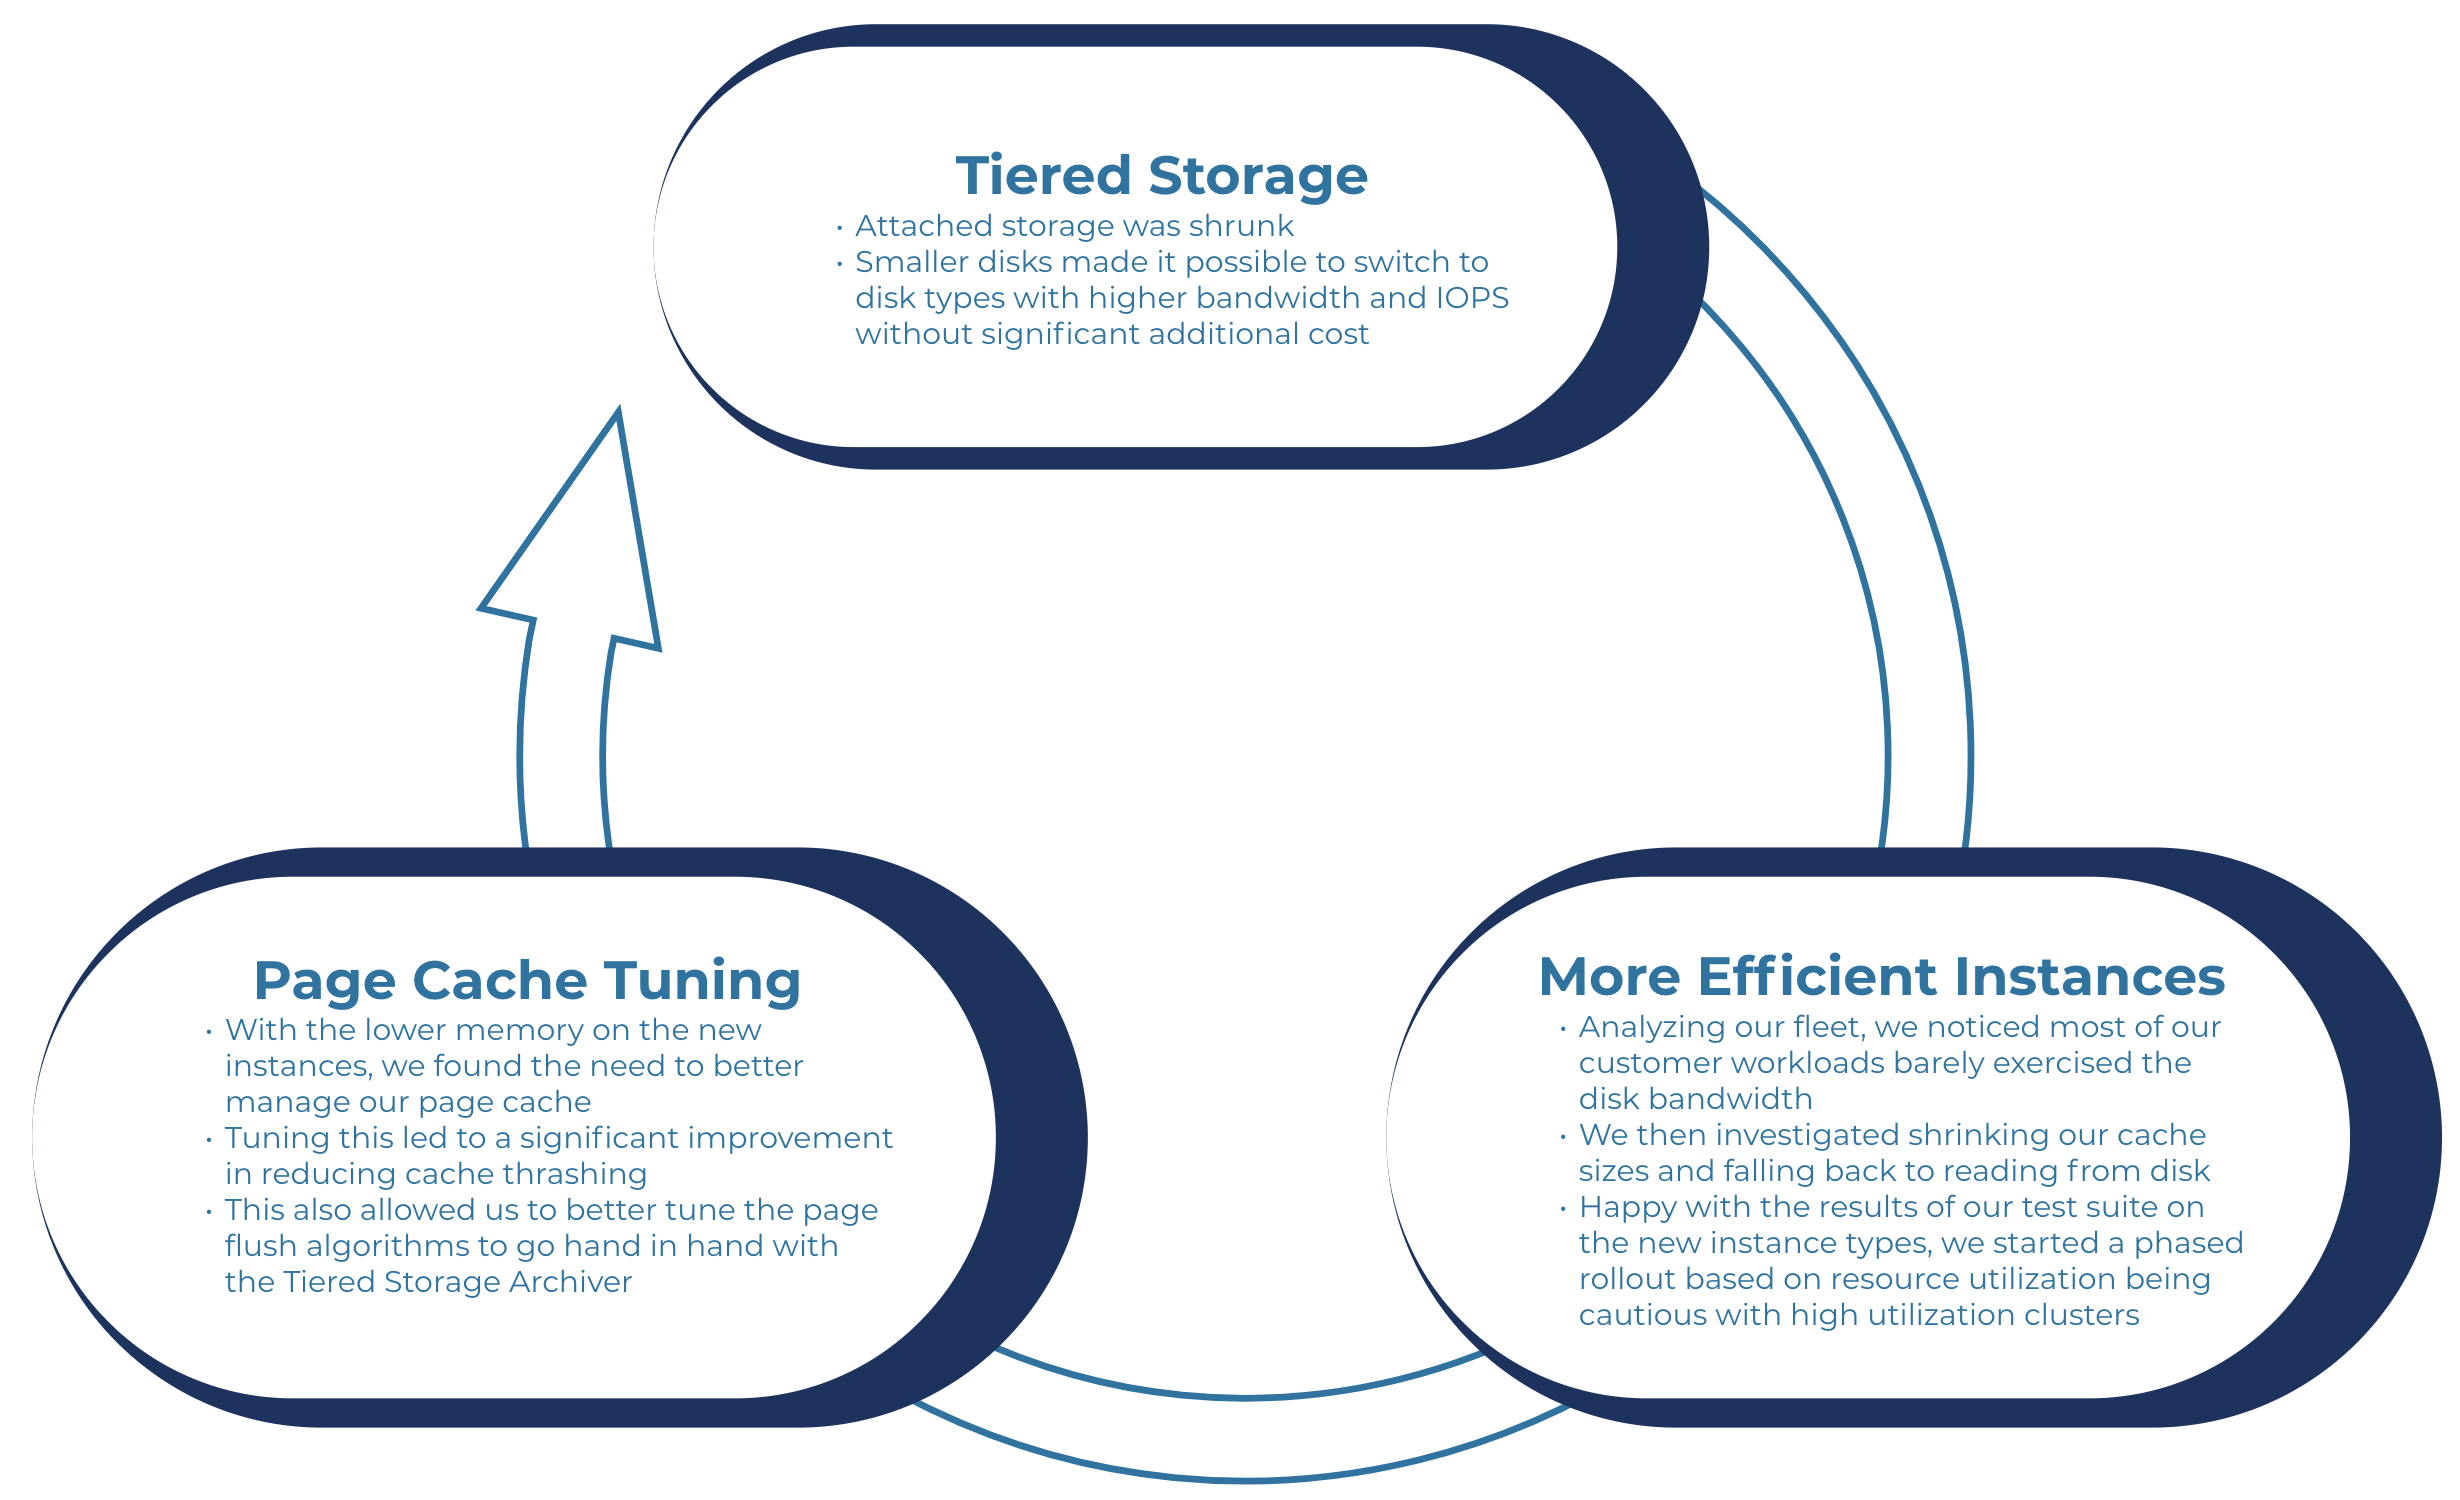
Finally, faster rollouts have led us to an interesting virtuous cycle. Tiered Storage accelerated our adoption of more efficient instance types, delivering significant cost savings, which in turn pushed us to better tune our page cache and the JVM heap, and that eventually benefited Tiered Storage, completing the circle.
Summary
In Confluent Engineering, we take performance and scalability seriously, and we expend a huge portion of our time in maintaining a high standard of performance and scalability. In this blog post, we covered the three principles that we, as an engineering team, use to drive our scalability and performance efforts:
- Principle 1: Know your users and plan for their workloads—it’s not a guessing game.
- Principle 2: Infrastructure matters—optimization in the cloud is as much about cost as it is about performance. Know the infrastructure that you have available to you.
- Principle 3: You can’t improve what you don’t see—without first-class observability, no performance effort will succeed.
If you run Apache Kafka yourself or work on a highly-optimized cloud-native system, we hope you will find these principles helpful and take away a few lessons that you can apply to your own implementations.
If you’d like to get started with Confluent Cloud, sign up for a free trial and use the promo code CL60BLOG for an extra $60 of free Confluent Cloud usage.*
Other posts in this series
¿Te ha gustado esta publicación? Compártela ahora
Suscríbete al blog de Confluent


Customer Intelligence Hub: A Single Pane of Glass for Customer Insight and Action
Customer Intelligence Hub unifies customer signals into a real-time, AI-powered view that helps GTM teams prioritize risk, identify opportunity, and act faster with contextual insights.