Apache Kafka®️ 비용 절감 방법 및 최적의 비용 설계 안내 웨비나 | 자세히 알아보려면 지금 등록하세요
Continuous Risk Analysis Demands the Right Data, Right Now
Back in the 2000s, I was lucky enough to be working at a fantastic software company called Algorithmics, supporting the largest banks with its risk analysis software. At the height of its reach, Algorithmics was voted as the leading enterprise risk firm for market risk, economic capital risk calculation, risk dashboards and collateral management. But for all the amazing things their related portfolio of products could do, there was one fundamental limitation for nearly all of them—all the analysis processes would run in batch.
No matter how much we split the processing and spread it out over multiple instances, it would take hours or sometimes days to execute and often break due to source data inconsistencies, metadata mismatches, or human coding errors. So then we would have to run it again or figure out where it broke, see if we could fix it, then partially restart the batch process from that same point. This was the reality of operational analytics back then. It is worth just clarifying that for the typical Global Systemically Important Bank (G-SIB), we are not talking about small amounts of data here, this is partly why all the batch runs took so long to complete. Typically, at the customers I worked for on risk analytics projects, we might be looking at many thousands of event updates per day, and for one of the largest investment banks in the early 2010s, this was in the order of many millions of trading events as the exchanges opened and closed around the world during a 24-hour period (following the sun).
What did this mean for the risk managers that relied on the results of this process for risk assessments and business analysis? Let’s say that during a given 24 hours of trading, the trading desks around the world at your bank had inadvertently taken high levels of positions in one type of asset across the trading book. Normally, you would have to wait until the next morning (T+1) for your risk reports to be delivered, when you should be able to spot this anomaly in the risk reporting figures, understand that you may be overexposed to a certain type of asset class due to the thresholds that have been set and, as a result, do some remediation or hedging to offset that risk. Risk managers need to trust the data is not erroneous.
If you do not have the reports in a timely manner or if the data in the reports is stale or incorrect this could lead to you not seeing this pattern, which in turn leads to an escalating adverse effect throughout your analysis and the entire risk process. This is just one example, but consider the many complex risk calculations in use throughout an entire organization. Inaccurate data feeding your risk engines could potentially put you at risk of fines from the regulator or even in extreme cases, being downgraded as an entity, in terms of your bank rating, which in turn affects your company’s stock value and reputational standing in the industry.
Let’s take a quick history refresher of some of the more memorable cases of risk failure that rocked the industry. Wind back almost 30 years. It’s 1995 and the unauthorized trading activities of a now infamous single trader has brought about the collapse of Barings Bank, one of the oldest and most prestigious banks in the world. The lack of effective risk management controls that should have alerted the institution to its risk exposure—and the trader’s fraudulent manipulation of internal systems to cover his tracks—was a wakeup call to the banking sector, and traders who didn’t account for prison time in their future earnings. And yet, just over a decade later we find another epic risk failure is the catalyst for the financial crisis of 2008. This time Lehman’s over exposure to toxic derivatives, comprised mostly of subprime mortgages, famously plummeted its stock value to zero proving it simply wasn’t too big to fail. Another financial institution bites the dust, bringing with it chaos throughout the entire financial markets.
With the global economic turmoil that ensued, a radical overhaul of rules and behaviors in risk management were promised by regulators and governments alike. But, as we know, history really does have a way of repeating itself. Fast forward to today. In March 2023 Credit Suisse, plagued with scandals of one kind or another for decades anyway, found itself over-exposed to the collapses of a US hedge fund and a UK finance firm. In the end its value and market confidence suffered so much irreparable damage that an emergency takeover by its famous rival, UBS, was engineered by the Swiss government to avoid another global market meltdown. At the same time, Silicon Valley Bank brought this history lesson full circle with the largest bank failure in the US since the 2008 crisis. It too collapsed due to deficiencies in its risk management resulting in a massive exposure to US government bonds that lost value as interest rates rose rapidly.
All of the above examples can be directly linked back to failures in risk management and analysis and it is notable that they span a 30-year period during which many attempts had been made to address these types of challenges. So what changed?
Batch to microbatch and beyond: has anything really changed?
In the intervening years since my work at Algorithmics (2011 to now), most IT projects that tried to address the challenges of better, faster risk analysis involved utilizing technology advancements like Hadoop, data lakes (or swamps), and a multitude of complex software layer offerings, mostly designed to help decompose monolithic database driven batch applications. What resulted instead was an infinite number of disparate, specialized applications and microservices, all doing specialist tasks and coupled to their own partially visible versions of the truth from the data lake. Many of these solutions have been built or assembled in-house, often by someone using the latest cutting-edge specialist tech or latest great new language, (Pig Latin anyone?), mostly it would seem, so they can add it to their resume before moving on to a better daily rate elsewhere, rather than focussing on whether it really contributed to the overall success for risk management and reporting.
Less cynically though, in almost every example tech strategy cited above, the fundamental premise of gathering all the data first, putting it somewhere into one central location and then analyzing it, has remained consistent.
Even capabilities touted as ‘streaming’ (such as Spark) were in reality just micro-batch-based systems running off data that was already at rest. So essentially these modernization efforts netted the same outcome as the batch processes they were replacing - data was still being consumed and assessed with a delay.
So then, why is it that data always seems to have to be at rest before we start to think about how we can gain real insight and value from it? I would postulate, because we always assume something needs to be motionless before we can measure it. Or if you prefer, because we are limited in our vision of what is possible, by the physical world we observe and experience. For example, have you ever tried to measure a cat? Unless you are a vet, it’s highly unlikely, mostly because you know it will be almost impossible to catch it, and even less likely it is going to sit patiently, still, and happy while you reach for your measuring tape. The point being you do not even try because you know it is a futile task that is likely to end in significant injury (to you, not the cat), so perhaps we assume it is the same with everything that's in motion, even data?
In addition, a consistent misconception of an event driven, data streaming platform is that it is only useful for fast moving data (like plumbing for the water in a house). Yet we can very easily argue all data changes over time, some data just changes slower than other data. Think of the various data sources required to calculate market risk - slow moving data can include situations like assets occasionally migrating from one area of the trading book to another or perhaps some types of stock that just do not change price very often, or even new types of trading products being added or removed. It might also be the way risk is measured like the capital reserve amount for the bank or the bank's thresholds for risk appetite on particular products, domiciled regions, or countries of various counterparties.
When it comes to batch operations on data generally, I would go as far to use the analogy that batch based insights gathering is really much more like trying to fill a bath with water, having the majority of your ‘pipes’ suffering from leaks and blockages.
Because figuring out how to change the paradigm is challenging, many businesses continue to repeat the same mistakes they have made before - instead of focusing on a strategic, ‘data centric’, infrastructure approach, they look at the individual use cases they want to address in isolation and make a decision to go with a siloed tactical resolution.
The number of times I have been told that “some use cases just do not need data streaming” or that “we just decided to go with a tactical ‘minimal viable product’ (MVP) first”, inherently helps prove my point. Using that approach will inevitably result in multiple siloed ‘tactical’ implementations actually becoming the long term ‘strategy’ and, inevitably, create duplication of data, data transformations, and of course costs.
From what I have observed, data solutions for addressing risk analysis have mostly grown organically out of somewhat siloed, big data ecosystem projects, attached to data lakes and customized visualization tools and have really not addressed the core challenges of risk management we discussed earlier, at all.
Truthfully, they might have been better off staying with what they had as a working system in batch, than spending vast amounts of time, money, and effort reinventing architectures for the modern era with very little improvement in the outcomes. It is a bit like buying a Ferrari in kit form, assembling it yourself but then putting a Fiat 500 engine in it—you have basically redressed a lawnmower!
Bringing real-time to risk calculations
So then, why are we writing about risk aggregation and reporting when we are thought of as a data streaming platform provider or even ‘just Kafka’?
Because I believe that we are at a new point of inflection in the evolution of software, leaning towards consolidation and simplification in systems design, where focus on specialized tools has begun to become more turned towards overall costs, reducing complexity while creating genuinely valuable outcomes.
In my opinion, one way to adopt a better approach for risk aggregation and analysis is to utilize event driven design and then take full advantage of all the real-time capabilities that Confluent Cloud offers to simplify and evolve to something much better.
Let’s consider this in the context of market risk management as an example. For those who aren’t familiar, this refers to the risk of a decline in the value of an investment due to factors such as market volatility, economic conditions, geopolitical events, and investor sentiment and the risk of over investing in related assets across your trading book thereby over exposing your trading book to risks you do not have the appetite or reserve capital to support. It’s no surprise that risk managers are highly dependent on timely and reliable data to proactively assess these uncertainties and take decisive action to effectively manage exposures - data ingestion that really needs to be collected from a multitude of sources continuously, throughout the day including portfolio positions, trading activity, market data, news feeds, immediately as something happens. You can see the problem therefore with running risk analysis from batch-based, periodically gathered insights, raised earlier.
So how can Confluent deliver an accurate real-time view of risk across all these data sources for quicker decision-making? As trades and legs of trades come off the pricing engines in the trading lifecycle, we can for example, collect them directly into the data streaming platform and then sort and transform them into secure and curated, data product objects that suit your analysis requirements. For example, create a data product per asset type, or perhaps by trading desk or trading book, as each new event comes in, and then run calculations for that data product object to get the current risk values for that level of the trading book. We can add in continuous, operational stress testing and risk factor analysis techniques, we can even perform Expected Shortfall (ES) also known as Conditional Value at Risk (CVaR) and for less volatile stocks, Value at Risk (VaR) calculations across the portfolio. Typically for an investment bank, the number of events can run to many millions per day.
Specifically, non-additive calculations can be performed by embedding calls to analytics from within Stream Processing capabilities such as our new offering of Flink in Confluent Cloud, extending whatever existing method you currently use to report on risk. You can then define & build data products that represent the calcs for the assets, ready to be subscribed to for results by downstream reporting such as Perspective or OLAP tools such as Snowflake or Druid. You can even incorporate the latest capabilities from Open AI (via Flink) to help assess and enrich insights, while in stream then automate change to your risk factors and generate alerts to notification systems when something steps outside what you set as an acceptable threshold for your risk appetite, as that event takes place.
Remember that Flink essentially allows you to define a modern equivalent to a relational data model in a RDBMS, but on top of the streaming data platform across clusters and topics, instead of on static data. Because of that, plus all the other fantastic features it brings to Confluent Cloud, it will play a major role in the evolution of an architecture like this.
Data streaming architecture for continuous risk reporting
Making this leap in design, (ironically the leap is actually to proactively simplify and generalize), can be a huge change and for some organizations too challenging a transformation to take without first defining new standards for internal architecture design and proving the benefits with pilots that deeply adopt a move to the event-driven, data product paradigm.
Benefits that are typically proven through pilots projects encompass more accurate prediction for consumption costs over time e.g., you know how much you spent last month, know how much your data estate is expected to grow over the coming year and because you continuously process the data as it arrives, (as opposed to using batch), there are way less peaks and troughs in your consumption throughout the forecast. Also because this is about evolving to a data streaming platform paradigm, you can look to de-emphasize the reliance on disparate, siloed, downstream specialized tools that can be very costly to maintain and usually create a high amount of duplication of data and the associated storage costs.
Fundamentally within streaming, this is the way we can break down and think about the flow and the design principles we need:
Consider it most simply as a directed graph flow or pipeline. Data enters at the source point via CDC or Connectors and loads into structures we call topics.
Topics can be used to help filter, clean, transform, and join with other topics to derive new topics that have greater value for the analysis we want to perform, (we can think of these as data products because they could be used for use cases other than purely risk analysis). We can then process these with capabilities like kstreams or ksqlDB, but for this proposition, the technology framework I believe is best suited for streaming risk management analysis is Flink as discussed in more detail below.
So let’s expand the previous diagram to include the processing element (Flink):
In this exploded version of the diagram the streaming data layer provides base data products organized around the risk reporting requirements of the business and then the processing of those data products is performed in a streaming data model built in Flink on top of the data, preparing the non-additive calculation reporting structure correctly for downstream consumption.
In this design, the core capabilities of the risk aggregation and analysis is performed in the data streaming platform itself, simplifying and streamlining the architecture while providing capabilities for lineage and governance and reducing duplication in data at rest in the downstream sink systems for reporting, which instead would subscribe to the data products provided by the streaming platform as the source for their ‘current state’ reporting needs.
In an event driven world, the risk reporting data products are updated for each priced trade or leg of trade as they come into the stream, the risks are calculated for each and then each level. Risk factors can be applied and stress testing performed for those assets, all as the data streams. This essentially means that you always have up-to-date data within the context of the value of the desks, books, regions, and portfolios you are assessing.
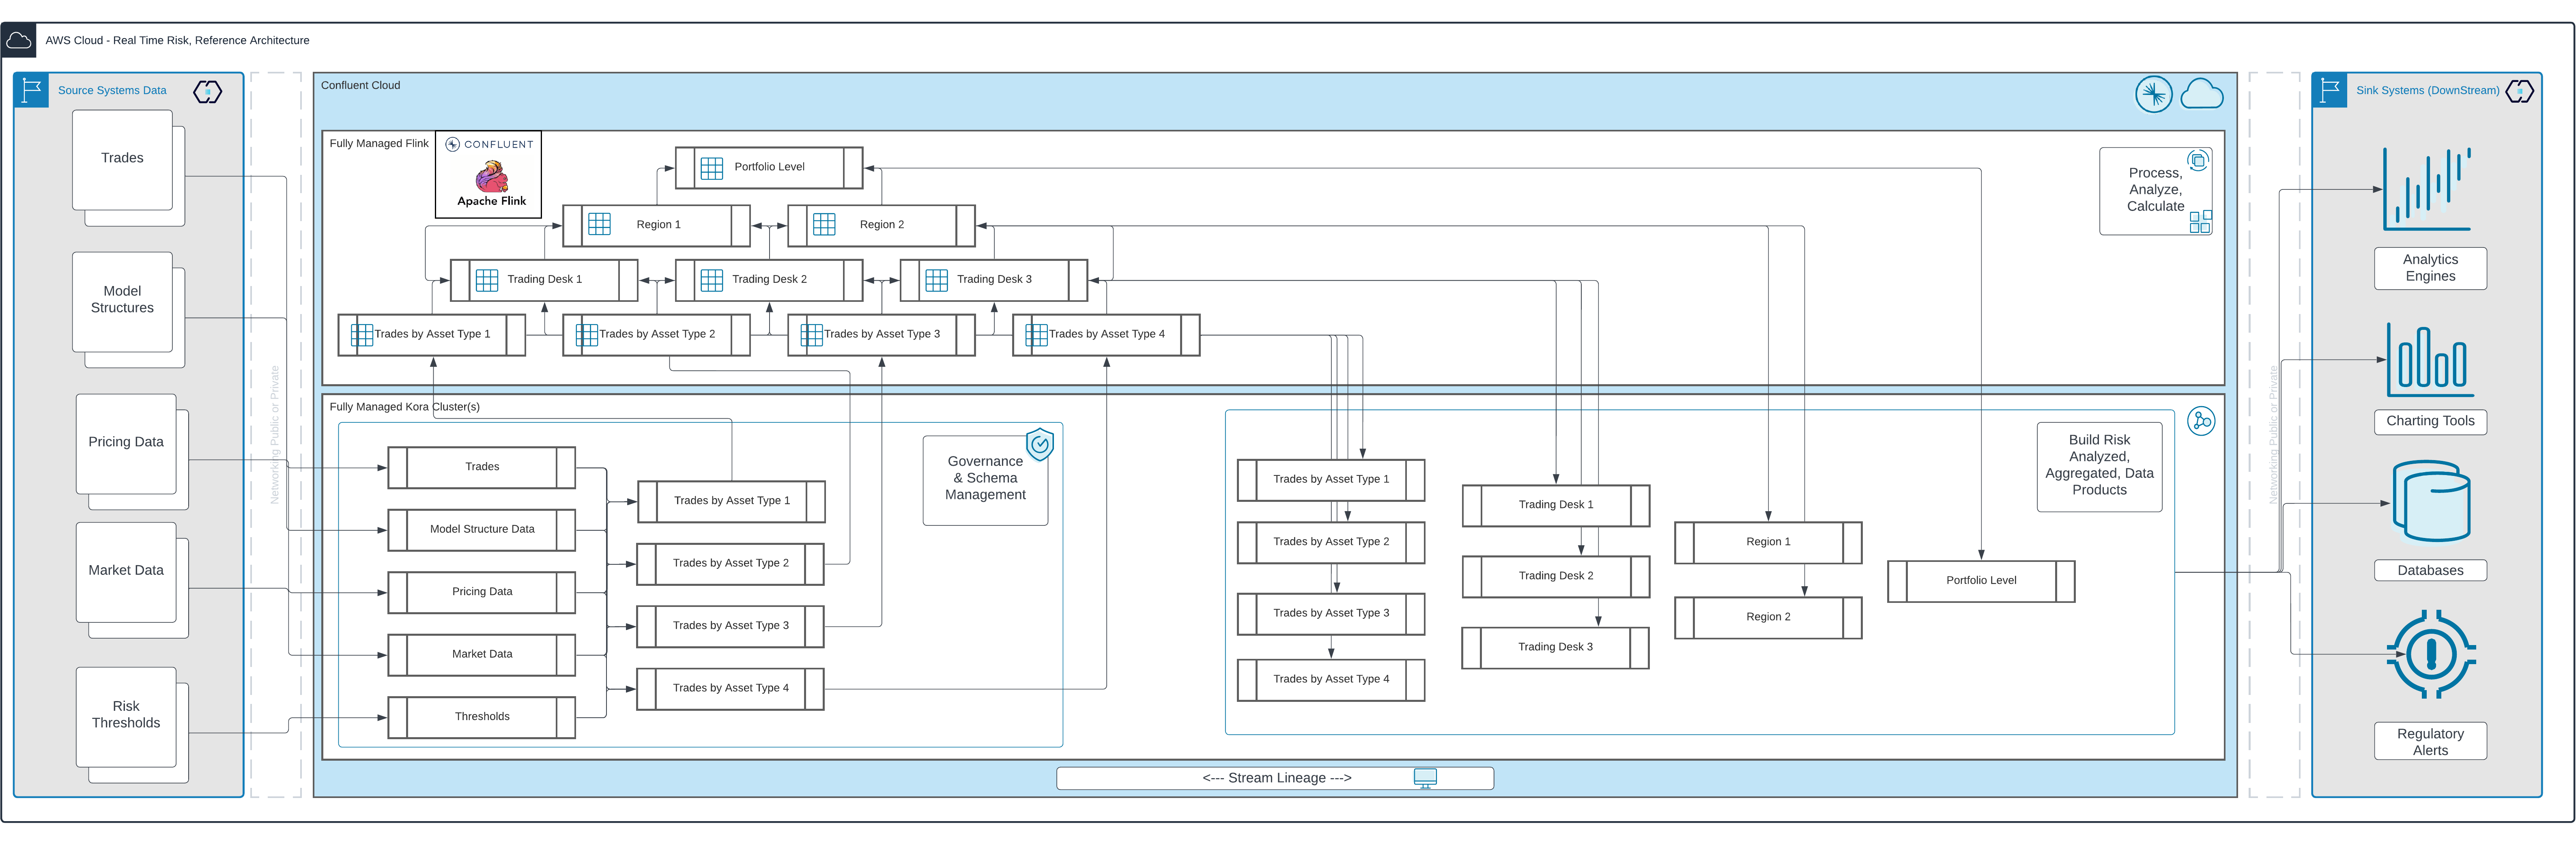
In terms of the full end-to-end flow, with Flink included, it might look something like this below reference architecture:
Adopting the method of curating the data products in Confluent Cloud will allow you to take full advantage of our Stream Governance and Stream Lineage capabilities, providing a full audit trail of every stream to meet your regulatory reporting requirements. You can also present your data products to less technical users via our new Data Portal interface—designed for users more interested in data engineering and outcomes than infrastructure (image below).
So then in summary, there is so much that can be streamlined, simplified and most importantly of all, gained in value from approaching real time or continuous risk analysis and reporting with a data streaming platform, why are you still here reading this blog 🙂?
As a reminder, these are the key takeaways:
Unlock the real potential of your data streaming platform to simplify and improve portfolio stress testing, risk aggregation and reporting
Aggregate accurate real-time view across multiple data sources for quicker decision-making
Create ‘current state’ aware data products with in-stream processing
Get continuous updates on real-time exposures as soon as any new trade or completed legs of trades come in
Better predict and cost out the consumption of your compute intensive reporting and analysis, avoid the peaks and troughs of batch based systems.
Decommission and save money on dedicated or specialized tools
Reduce repetition of data storage layers
Integrate with downstream analytics and reporting tools to create regulatory risk reports as needed
Simplify, simplify, simplify
Manage and process as much as you can securely in the stream
Become the hero to your traders and your risk officers, all at the same time!
LIVE THE STREAM!
이 블로그 게시물이 마음에 드셨나요? 지금 공유해 주세요.
Confluent 블로그 구독


InfiniteWatch + Confluent: Turning Customer Interaction Data into Real-Time Intelligence
InfiniteWatch is building an AI-native customer interaction intelligence platform that unifies these streams into a continuous, real-time understanding of customer behavior and operational state. At its core is Confluent.


Focal Systems: Boosting Store Performance with an AI Retail Operating System and Real-Time Data
Discover how Focal Systems uses computer vision, AI, and data streaming to improve retail store performance, shelf availability, and real-time inventory accuracy.