Ahorra un 25 % (o incluso más) en tus costes de Kafka | Acepta el reto del ahorro con Kafka de Confluent
Diagnose and Debug Apache Kafka Issues: Understanding Increased Request Rate, Response Time, and/or Broker Load
When you encounter a problem with Apache Kafka®—for example, an exploding number of connections to your brokers or perhaps some wonky record batching—it’s easy to consider these issues as something to be solved in and of themselves. But, as you’ll soon see, more often than not, these issues are merely symptoms of a wider problem. Rather than treat individual symptoms, wouldn’t it be better to get to the root of the problem with a proper diagnosis?
If you're looking to level up your Kafka debugging game and understand common problems as well as the ailments that an individual symptom could be pointing to, then this blog series is for you.
Symptoms in the series
Throughout this blog series, we’ll cover a number of common symptoms you may encounter while using Kafka, including:
- Reduced Message Throughput
- Increased Request Rate, Request Response Time, and/or Broker Load (this post)
- Increased Consumer Rebalance Time
- Increased Connections
These issues are common enough that, depending on how badly they’re affecting your normal operations, they might not even draw much attention to themselves. Let’s dive into each of these symptoms individually, learn more about what they are and how they make an impact, and then explore questions to ask yourself to determine the root cause.
In this blog post, we’ll cover a few related symptoms…
Increased request rate, request response time, and/or broker load
It can be easy to go about life without thinking about them, but requests are an important part of Kafka; they form the basis of how clients (both producers and consumers) interact with data as it moves into and out of Kafka topics, and, in certain cases, too many requests can have a negative impact on your brokers. To understand how requests can affect the brokers, it’s important to be familiar with what happens under the hood when a request is made.
Client request lifecycle
While all we see is a producer.send() or a consumer.poll(), under the hood, these calls are translated into requests that are being sent along to the brokers for them to process. It may seem pretty simple from the client’s point of view, but, in reality, it’s a detailed process with a lifecycle that we can track.
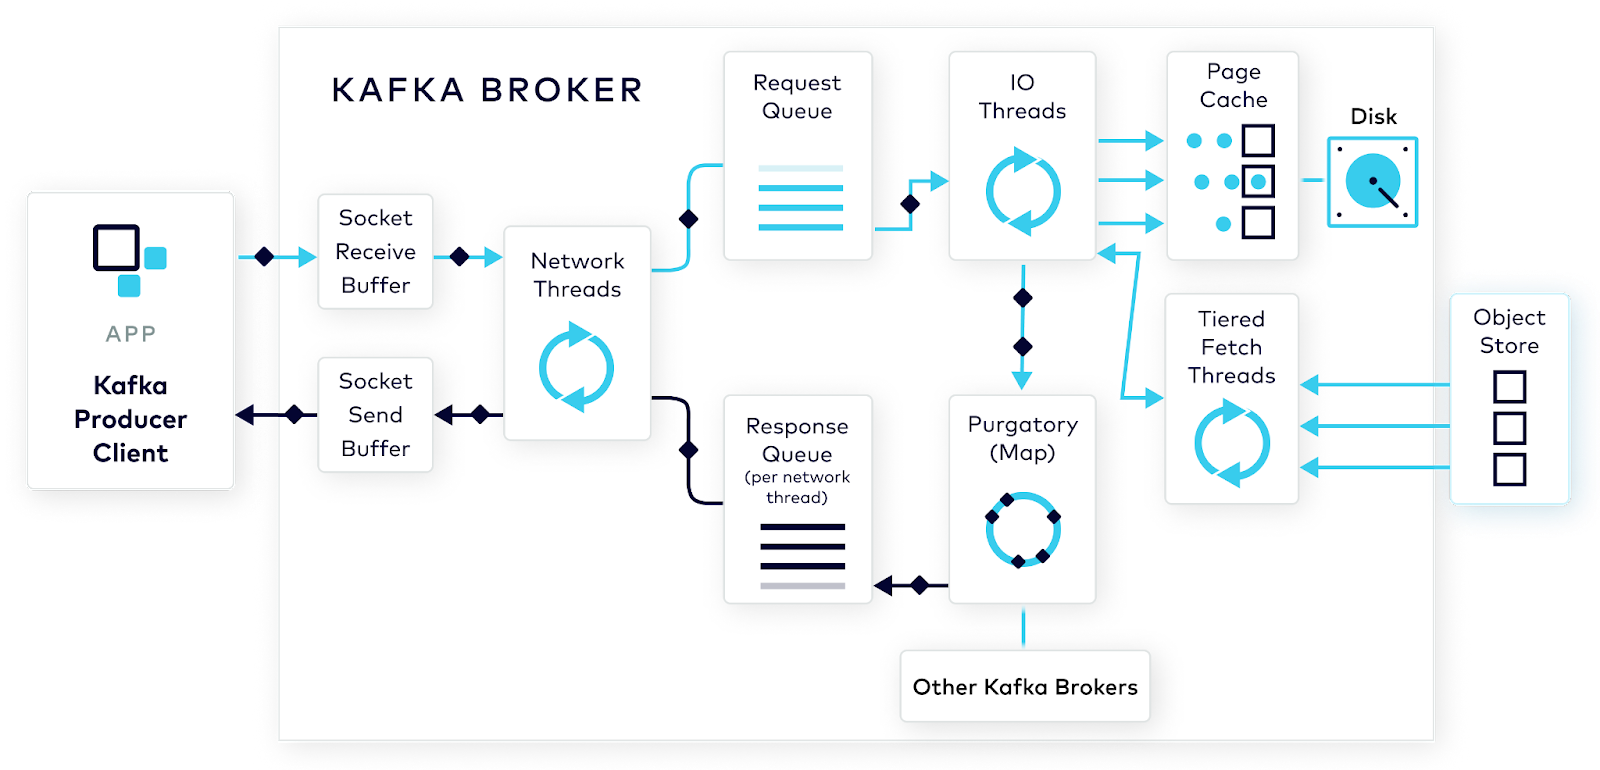
Let’s consider a request, in this case, a call to producer.send():
-
The producer receives records to produce; as this happens, it uses a configurable partitioner to determine which topic-partition the records belong to. It then batches (and optionally compresses) the incoming records according to batch.size and linger.ms. We’ll suppose here that there are a number of records being sent to a single topic-partition. producer.send() is called.
-
The request is sent to the broker’s socket receive buffer where it waits until it's picked up by an available network thread from the pool. Once a network thread reads the request from the socket buffer, it forms it into a produce request object and adds it to the request queue.
-
Requests are picked up from the request queue by a thread from the I/O thread pool. The I/O thread performs some validations before appending the data to the physical commit log underlying the topic-partition.
-
Durability of data is important, so we’re not done here. Kafka relies on replication of this data to multiple broker nodes with the cluster. In the default scenario, the broker won’t acknowledge the produce request until it’s been fully replicated across the cluster. There's no use tying up the I/O threads during the replication process, so, in the meantime, the request object is kept in a map-like structure called purgatory. After the data is fully replicated, the broker takes the request object out of purgatory, generates a response object, and places it on the response queue.
-
From here, the network thread can pick up the response, and send its data to the outgoing socket send buffer. It waits for the entire response to be received by the producer client before moving on to the next request.
It should now be clear just how much is involved in a single call to producer.send(), and nearly the same is true of consumer.poll(). While Kafka is built to handle high throughput, a sudden influx of requests can put strain on the brokers and cause problems. So it’s in our best interest to know when this is happening.
Metrics to know
A vital part of maintaining a healthy Kafka Cluster is monitoring your brokers through JMX metrics. Doing so means that you’re more likely to notice early on when brokers are strained. Although there are a ton of broker metrics available, keeping track of a handful of key metrics will help you to maintain happy and healthy brokers.
-
kafka.network:type=RequestMetrics,name=RequestsPerSec,request={Produce|FetchConsumer|FetchFollower}: This is your vanilla request rate—the number of incoming requests per second. In general, this is the best place to look to know if your brokers are potentially being strained. Intermittent spikes in this value could indicate that individual clients are causing problems in the way they’re making requests.
If you’re relatively new to JMX metrics, know that you can get even more information on other types of requests by changing the request type in the above metric. For example, change RequestMetrics to OffsetFetch or CommitOffsets. In particular, OffsetFetch or CommitOffsets are great ways to check into the health of your consumers (and also some producers using exactly once semantics). -
kafka.network:type=SocketServer,name=NetworkProcessorAvgIdlePercent: This metric describes the percentage of time that your network threads are idle. Since all Kafka requests are routed through the network threads (as seen above), this metric is pretty important. 0 means that all resources are unavailable, and 1 means all resources are available. Generally, you’ll want this value to be higher so that your brokers aren’t working too hard. If you’re hosting your own Kafka cluster, anything above 30% is good enough; on average, across Confluent Cloud-based brokers, this value has a much higher threshold.
-
kafka.server:type=KafkaRequestHandlerPool,name=RequestHandlerAvgIdlePercent: Similar to the NetworkProcesessorAvgIdlePercent, this metric is a percentage from 0 to 1 of how idle the I/O threads––also known as the Request Handler Threads––are. The metric is key in alerting on how loaded a broker is. Similar to the last metric, ideally this value should be above 30% for self-hosted clusters and much higher for Confluent Cloud-based brokers.
-
kafka.network:type=RequestChannel,name=RequestQueueSize: This metric describes the number of requests in the request queue at any given time. A higher count means that the queue is congested, so it’s better to have a lower value. In conjunction with NetworkProcessorAvgIdlePercent, you can get a good idea of how busy the full Kafka request pipeline is.
-
kafka.network:type=RequestMetrics,name=TotalTimeMs,request={Produce|FetchConsumer|FetchFollower}: This series of metrics describes the total time it takes for a given type of request—produce, fetchConsumer, and fetchFollower—including the time it takes to send. It gives a pretty good idea of your system’s overall latency. You’ll want this number to be lower to indicate a healthier cluster.
In association with TotalTimeMs, the following set of metrics can help to dig deeper into what is increasing the processing time of your requests:
-
kafka.network:type=RequestMetrics,name=RequestQueueTimeMs,request={Produce|FetchConsumer|FetchFollower}: This value is the amount of time that requests wait in the request queue before being picked up by the I/O thread pool. A larger number might indicate that your I/O threads are too busy and can’t keep up with the incoming requests.
-
kafka.network:type=RequestMetrics,name=LocalTimeMs,request={Produce|FetchConsumer|FetchFollower}: Using this metric, you’ll know how long the Leader Broker is taking to process a request. This can help to determine whether or not the issue is related to disk or page cache performance.
-
kafka.network:type=RequestMetrics,name=RemoteTimeMs,request={Produce|FetchConsumer|FetchFollower}: Similar to LocalTimeMs, this metric tells you how much time is being spent waiting for follower nodes to handle and replicate the request. Using this metric can help determine if this is a replication performance issue.
-
kafka.network:type=RequestMetrics,name=ResponseQueueTimeMs,request={Produce|FetchConsumer|FetchFollower}: This metric is also similar to RequestQueueTimeMs; it indicates how long the response is spending in the Response Queue. Use it to understand if network threads are overloaded.
-
kafka.network:type=RequestMetrics,name=ResponseSendTimeMs,request={Produce|FetchConsumer|FetchFollower}: Finally, this metric specificies how long it is taking to deliver a response back to the client. For Produce requests, this should typically be a very low amount of time and should reflect more on your network performance. For FetchConsumer, this will reflect the amount of time it’s taking to send over all the records to the consumer. For FetchFollower, this will reflect how long it’s taking to send over the records needing to be replicated to a partition follower.
These request-focussed metrics are a great place to start, but they’re really just the tip of the iceberg when it comes to monitoring your clusters.
Continuing the diagnosis
A high request rate can be a symptom of a variety of issues depending on what else you’re seeing across your cluster at a given time. As you walk through these followup questions, you may notice that many of them are similar to those seen in the previous blog post where we covered reduced message throughput. In general, inefficient batching will lead to increased requests. That being said, it’s not always the case that an increased request rate implies reduced message throughput and inefficient batching.
In addition to seeing increased request rates and a high load on brokers…
… do you find that your records aren’t being compressed efficiently? Maybe linger.ms is set too low—or not set at all! As seen in the request lifecycle, compression occurs before the request is sent to the broker and it’s done over an individual batch. Compression will be more efficient for larger, fuller batches of records.
… are you witnessing a high rate of requests being made? If your Kafka is cloud-based, check into your KafkaProducer workloads to see if they’re sized appropriately. When starting out with cloud-based instances, it’s common to use smaller resources. But, as requirements change and grow over time, resizing workloads isn’t always the first thing that’s considered. This can also mean doing some vertical scaling to help constrict the spread of records among service instances to improve batching performance.
It’s also worth noting that, depending on the language, some clients make more metadata requests than others. This sounds harmless, but extra metadata requests can really bombard the brokers over time. So if you are seeing spikes in requests, try checking into your client implementation.
… are you seeing increased connections and reduced batching? This could indicate that you’re using multiple KafkaProducer instances within a single service or process. Maybe you’ve recently migrated from another messaging technology and were trying to minimize code changes or perhaps you didn’t quite understand the thread safety of a KafkaProducer. Either way, it could be time to check into your client code.
… have you considered how often your consumers are committing? It’s possible that you're overwhelming your brokers through over-committing. When consumers commit, a record is sent to the consumer offset topic to keep track of their most recent offset. The consumer offset topic is a compacted topic; with more frequent commits, there are more client requests for the I/O Threads to handle as well as records in the consumer offset topic, and, thus, more records to compact. While compaction is more of a background process that tries not to affect production and consumption, the process does require CPU usage and heap space, which could affect the brokers.
… has your Kafka instance lost records? You may not be handling producer callbacks in an optimal way—or maybe you’re not handling them at all!
Conclusion
The next time you hit a snag in your Kafka cluster, take some time to diagnose and debug. Before committing to making changes to your applications, it’s important to understand what’s causing your problem and uncover the underlying ailment.
To continue on in your Kafka practice, check out these other great resources to help you along the way:
- Check out the next symptom in our diagnose and debug series: Increased Consumer Rebalance Time
- Avoid potential problems entirely by diving into common Apache Kafka mistakes and pitfalls that everyone is likely to encounter.
- Give Confluent Cloud a try and see what fully-managed, cloud-based Kafka has to offer you.
- Plug into a community – check out the Confluent Community Slack and Confluent Forum.
¿Te ha gustado esta publicación? Compártela ahora
Suscríbete al blog de Confluent


Helpful Tools for Apache Kafka Developers
Apache Kafka® is at the core of a large ecosystem that includes powerful components, such as Kafka Connect and Kafka Streams. This ecosystem also includes many tools and utilities that […]

Diagnose and Debug Apache Kafka Issues: Understanding Reduced Message Throughput
When you encounter a problem with Apache Kafka®—for example, an exploding number of connections to your brokers or perhaps some wonky record batching—it’s easy to consider these issues as something to be solved in and of themselves...