[Virtual Event] Agentic AI Streamposium: Learn to Build Real-Time AI Agents & Apps | Register
Build Real-Time Observability Pipelines with Confluent Cloud and AppDynamics
Many organisations rely on commercial or open source monitoring tools to measure the performance and stability of business-critical applications. AppDynamics, Datadog, and Prometheus are widely used commercial and open source toolsets. In fact, some organisations use all of the above with various teams and use cases. A common usage pattern for these tools is to integrate multiple data sources and provide a single pane of glass for DevOps engineers to monitor and manage their systems.
Confluent Cloud is a fully managed Apache Kafka® as a service offering backed by a 99.95% uptime SLA. While Confluent takes the burden of managing and monitoring the infrastructure for performance, it’s useful to monitor specific runtime metrics such as throughput per topic to give that warm feeling of overall application health.
The goal of this tutorial is to explain how to write and deploy a source and sink connector pipeline that can consume Confluent Cloud metrics and, via Kafka Connect, push these metrics into the target monitoring system, in this case, AppDynamics. To follow along with the tutorial, you need access to both a Confluent Cloud cluster to extract metrics and an AppDynamics controller to push these metrics into. Alternatively, you can use some parts of the tutorial to build your own monitoring pipeline.
Kafka Connect architecture
Kafka Connect provides a framework for joining data from multiple systems together. There are two types of connectors: source connectors that take data from external systems and stream it into Kafka and sink connectors that take data from Kafka and stream it to external systems.

An example Confluent Cloud Metrics Source project is provided that reads from the Confluent Cloud Metrics API and produces to Kafka in a standardised format and can stream into one or many monitoring solutions. Confluent provides supported sink connectors for AppDynamics, Datadog, and Prometheus on the Confluent Hub.
This tutorial uses AppDynamics as a destination for the data. AppDynamics is an interesting option as it provides baselining technology over metrics, which means it learns the normal behaviour for monitored systems and provides an alert if some metric or part of the system is behaving abnormally based on what it’s previously observed.
Anatomy of a source connector
For the source, I created a Confluent Cloud Metrics Source Connector as an example Java source connector. This section describes how it works from a coding point of view. If you’re more interested in how to install and configure this, skip to the next section.
The class MetricsAPISourceConnectorConfig extends org.apache.kafka.common.config.AbstractConfig and defines all the configuration options and documentation supported by the connector. Mandatory parameters such as the target topic, Confluent Cloud cluster ID and user credentials that are specified in this file. Optional parameters such as ccloud.topic.level.metrics, which controls whether clusters of topic-level metrics are collected, are defined with a default value.
The principal class in the project is MetricsAPISourceTask, which extends org.apache.kafka.connect.source.SourceTask.This class implements four key methods that control how the connector works:
public String version() {...}
public void start(Map<String, String> map) {...}
public void stop() {...}
public List<SourceRecord> poll() throws InterruptedException {...}
The version() method returns the connector version, and the start() and stop() methods are called at the beginning and end of the connector lifecycle to initialise or clean up any resources.
The poll() method drives the main work of the connector. The poll method is called continuously and its job is to fetch SourceRecords from the target system (Metrics API in this case) and return a list of these.
As the Metrics API supports metrics at minute granularity, the code initially sleeps the thread until sample time. The Metrics API offers a REST interface, and the following code uses a MetricsAPIHttpClient instance to:
- Retrieve a list of metrics types available on the Metrics API
metricsTypes = httpClient.getDescriptors();
- Retrieve current values for each metric type that is returned
metrics = httpClient.getMetrics(metricsTypes);
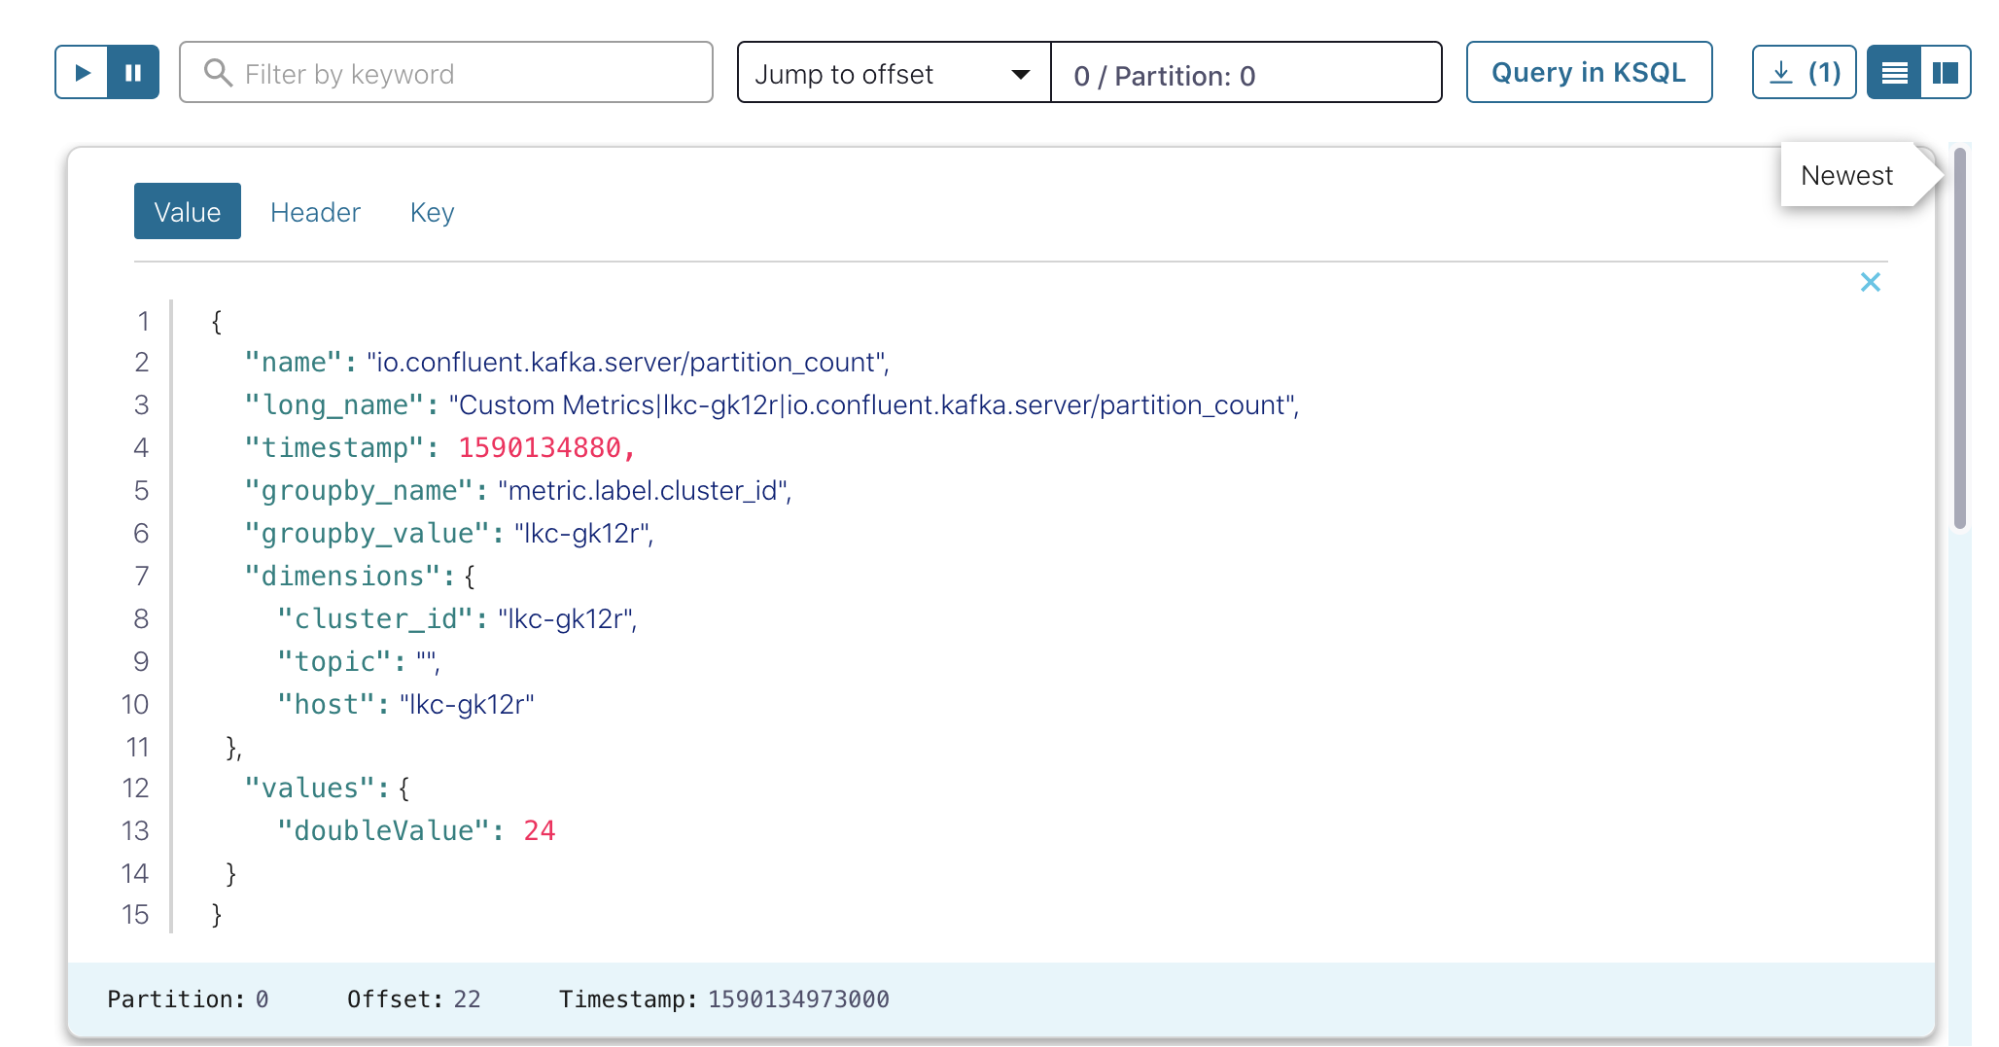
Another interesting class is MetricsAPISchemas. This class defines, in code, the schema that is applied to the records. If Confluent Schema Registry is configured, the code then automagically translates this to the configured schema type and publishes it.
Please see the code for more details and, if it’s useful, modify it for your projects. For more advice on writing your own connectors, see this blog post on creating Kafka Connectors with the Kafka Connect API.
Install Confluent Platform and connectors
Follow step 1 on the Confluent Platform Quick Start to install a local instance that includes Kafka, Connect, Confluent Control Center, and the command line tools used in the following example. In a production scenario, you may choose to feed the data pipeline via a Confluent Cloud or Confluent Platform cluster depending on your use case.
Follow the instructions on the project to compile and install the Confluent Cloud Metrics Source Connector. The AppDynamics sink connector can be installed using the confluent-hub command line tool that ships in the hub:
confluent-hub install confluentinc/kafka-connect-appdynamics-metrics:latest
Once all the connectors have been installed, restart Connect to load the newly installed code:
confluent local stop connect
…
confluent local start
Configure the Kafka connectors
Use the Connect REST API to configure the Connect instances, beginning with the Metrics API connector.
Create a file called CCloudMetrics.json with the following content:
{
    "name": "CCloudMetrics",
    "config": {
        "name": "CCloudMetrics",
        "connector.class": "com.github.shmoli.kafka.connect.source.metricsapi.MetricsAPISourceConnector",
        "tasks.max": "1",
        "key.converter": "io.confluent.connect.avro.AvroConverter",
        "key.converter.schema.registry.url": "http://localhost:8081",
        "value.converter": "io.confluent.connect.avro.AvroConverter",
        "value.converter.schema.registry.url": "http://localhost:8081",
        "errors.log.enable": true,
        "errors.log.include.messages": true,
        "ccloud.user.id": "<CC User>",
        "ccloud.user.password": "<CC Pass>",
        "ccloud.cluster.id": "lkc-XXXX",
        "ccloud.topic.level.metrics": true,
        "kafka.topic.name": "CCloudMetrics",
        "name.prefix": "Custom Metrics|",
        "name.separator": "|"
    }
}
You need to provide valid entries for the user, password, and cluster ID in order for the Confluent Cloud instance to be monitored. The topic-level metrics field controls whether the connector returns metrics for each topic (true) or aggregates metrics at a cluster level. This example uses the local Schema Registry and Apache Avro™ serialisation formats for the schema, although JSON and Protobuf are also supported. Specify the topic name, in this case, CCloudMetrics.
A couple of configurations at the end make the data more friendly for AppDynamics. First, add a name prefix to the long name field so that AppDynamics puts the data in the “Custom Metrics” section of the application. Second, in the name separator field, use a “|” character so AppDynamics can parse this.
Post the connector using curl:
curl -v --request POST \
    --url http://localhost:8083/connectors \
    --data "@./ConnectorConfig.json" \
    --header "Content-Type: application/json"
If this is successful, you will get a 201 response:
< HTTP/1.1 201 Created
In Control Center (http://localhost:9021/clusters), confirm that the new topic was created and is getting populated with data in the topics view.

For the AppDynamics sink, use the following example file, AppDynamicsConnect.json:
{
    "name": "AppDynamicsSink",
    "config": {
        "transforms": "RenameField",
        "transforms.RenameField.type": "org.apache.kafka.connect.transforms.ReplaceField$Value",
        "transforms.RenameField.renames": "name:short_name,long_name:name",
        "value.converter.schema.registry.url": "http://localhost:8081",
        "key.converter.schema.registry.url": "http://localhost:8081",
        "name": "AppDynamicsSink",
        "connector.class": "io.confluent.connect.appdynamics.metrics.AppDynamicsMetricsSinkConnector",
        "tasks.max": "1",
        "key.converter": "io.confluent.connect.avro.AvroConverter",
        "value.converter": "io.confluent.connect.avro.AvroConverter",
        "topics": "CCloudMetrics",
        "machine.agent.host": "http://localhost",
        "machine.agent.port": "8293",
        "behavior.on.error": "log",
        "reporter.result.topic.replication.factor": "1",
        "reporter.error.topic.replication.factor": "1",
        "reporter.bootstrap.servers": "localhost:9092",
        "confluent.topic.bootstrap.servers": "localhost:9092",
        "confluent.topic.replication.factor": "1"
    }
}
The AppDynamics sink posts data using an AppDynamics machine agent. This must be configured to connect to a suitable controller and to use the HTTP listener, which defaults to port 8293. The machine agent host and port are configured above. See the standalone machine agent HTTP listener documentation for more details.
The configuration also uses Single Message Transformations to rename some of the fields, which is a powerful way to transform message content as it passes through Connect. In this case, configuring the long name that was modified in an earlier step to allow AppDynamics to parse it.
Again, post the connector using curl:
curl -v --request POST \
    --url http://localhost:8083/connectors \
    --data "@./AppDynamicsConnect.json" \
    --header "Content-Type: application/json"
Check for a 201 response:
< HTTP/1.1 201 Created
Set up monitoring
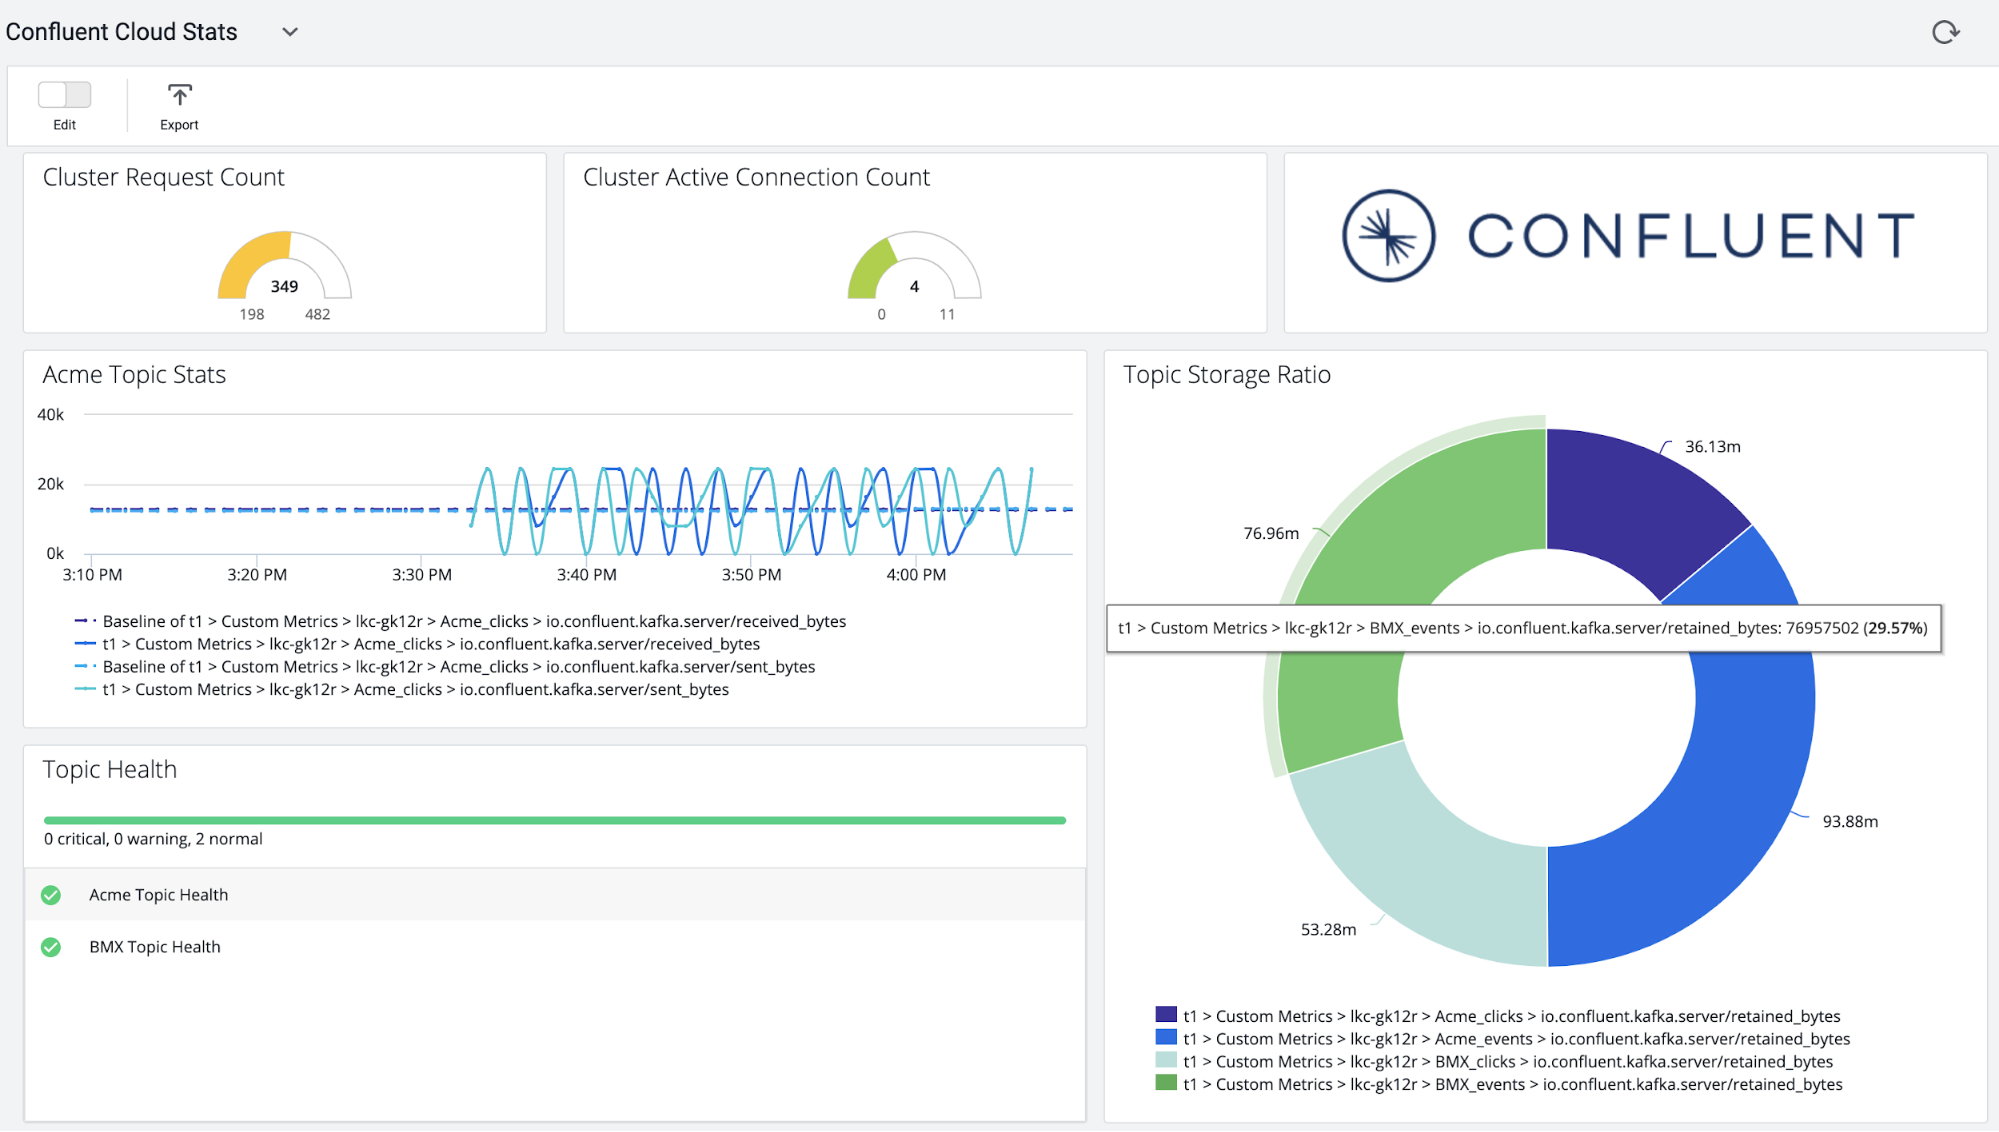
Now that the pipeline is complete, Confluent Cloud metrics will stream into the AppDynamics controller. At this point, you can set health rules and create dashboards to monitor the health of your application.

Next steps
Interested in learning more about Confluent and Kafka Connect? Download the Kafka Connect AppDynamics Metrics Connector to get started! You can also check out Confluent Cloud, a fully managed event streaming service based on Apache Kafka. Use the promo code CL60BLOG to get an additional $60 of free Confluent Cloud.*
Avez-vous aimé cet article de blog ? Partagez-le !
Abonnez-vous au blog Confluent
Integrating AI Into Apache Kafka Architectures: Patterns and Best Practices
Kafka is your event backbone, not your inference runtime. This guide breaks down three patterns for running AI alongside Kafka (external API, embedded, sidecar), when to use each, and how to handle topic design, dead-letter queues, idempotency, and LLM cost control.
Why Real-Time Stream Processing Beats Batch ETL for AI Data Freshness in 2026
Batch ETL feeds AI models data that's hours old. That causes context drift in RAG, training-serving skew in fraud detection, and broken operational AI. This guide covers the Ingest, Process, Serve architecture using Kafka and Flink to keep embeddings, features, and context fresh in milliseconds.

