Apache Kafka®️ 비용 절감 방법 및 최적의 비용 설계 안내 웨비나 | 자세히 알아보려면 지금 등록하세요
Integrating Apache Kafka Clients with CNCF Jaeger at Funding Circle Using OpenTelemetry
At Funding Circle, we rely heavily on Kafka as the main piece of infrastructure to enable our event-driven-based microservices architecture. There are numerous organizational benefits of microservices, however a key challenge is being able to understand the system as a whole due to the decentralized nature and constant evolution of new and existing services. This incomplete picture has a detrimental impact on a couple of dimensions.
First, we could reduce our mean time to recover when addressing issues in production if we had a way to quickly diagnose problems and affected services at a glance. This increased awareness could also affect our current on-call policies, which could be improved by tapping into an enhanced source of observability. Second, an increased awareness of the end-to-end system could bring to light opportunities to simplify redundant business services or infrastructure, flag single point of failures, and produce more reliable documentation. We wanted to keep the advantages that decentralization brings without trading off the ability to look at all the pieces together when we need to.
Distributed tracing is a method used to profile and monitor applications. It helps pinpoint where failures occur, identifies what causes poor performance, and provides visibility into the flow of a system across its services and protocols. It is typical for distributed systems to aggregate these traces to allow for a holistic examination.
This post covers the basics for understanding what options are available for Apache Kafka® telemetry when it comes to tracing. We’ll start by describing the current state of tracing in the Kafka ecosystem before introducing the OpenTelemetry instrumentation tools and their functions and finishing with a working example of how Funding Circle is planning to make these concepts work together across the range of Confluent products.
This post will equip you with the ability to trace the life cycle of events as they move across Kafka-enabled services.
The state of tracing in Kafka
Tracing of an application will normally fall into one of two categories.
Intrusive
Intrusive refers to tracing methods that require the source code of the target application to be modified to some extent. When it comes to Kafka clients, these modifications usually come in one of two forms.
Decorated consumer/producer
By introducing a middleman, which respects the contract of a consumer/producer, we are free to introduce new logic to produce new artifacts when this middleman is commanded to either consume or produce a record. This middleman would act as a layer wrapping around an “actual” consumer/producer, which would perform the Kafka operations.
Here’s an example of this mechanism.
Interceptors
The introduction of Interceptors (KIP-42) has made it possible to attach classes to a consumer or producer. These classes are then notified of any events relevant to a record in the consumer or producer, respectively. We can take advantage of this event-based mechanism and produce new trace artifacts with every event.
Here’s an example of this mechanism.
Non-intrusive
Non-intrusive means that no modifications are required to the source code of the target application.
In-process
For applications that rely on the JVM (i.e., applications not using librdkafka) to consume and produce their records, the easiest solution is to take advantage of the Java Instrumentation API. This API provides the ability to inject byte codes to methods for gathering data. Because these injections are append only, they are considered safe to use as they won’t modify application state or behavior.
An implementation to the Instrumentation API is usually provided by a separate JAR, which is then loaded on application start with the -javaagent parameter. A JAR that implements the Java Instrumentation API is normally referred to as a Java agent.
Here’s an example of this mechanism.
Out-process
The obvious choice here is to employ a sidecar container if your application is running in a container orchestrator like Kubernetes. Taking advantage of a shared state, sidecar containers can be used to augment/intercept Kafka traffic to and from Kafka clients in order to encrypt data, implement ACL mechanisms, or in our case, collect and export telemetry.
Another option gaining popularity is eBPF. Broadly speaking, the extended Berkeley Packet Filter allows a program to hook into events triggered by the Linux kernel. System calls, network events, and function entry/exit are just some of the hooks available. It’s not hard to imagine using an eBPF program to subscribe to Kafka-related function calls or IO/network requests and derive meaningful telemetry. For an example of this mechanism at work, take a look at the Cilium project.
Non-intrusive, Kafka-based services instrumentation with OpenTelemetry
OpenTelemetry is a project by the Cloud Native Computing Foundation (CNCF) that provides a set of vendor-neutral components and specifications for collecting metrics, logs, and traces. It promotes the idea of avoiding vendor lock-in and observability by striving to make service instrumentation effortless. The main components from OpenTelemetry that were leveraged for this distributed tracing example are described below.
Instrumentation libraries
Instrumentation libraries are intended to collect framework-, library-, and runtime-specific information, and expose it via the OpenTelemetry API. The aim is to enable service observability with almost no integration effort. In this example, we’ll be using opentelemetry-java-instrumentation, which takes advantage of the Java Instrumentation API to inject OpenTelemetry auto instrumentation as a JVM agent. Kafka client and Kafka Streams libraries are already part of the impressive set of popular libraries, frameworks, and application servers covered by the OpenTelemetry Java instrumentation agent.
Collector
The collector receives telemetry data collected by instrumented services. The data is then aggregated, sampled, and even enriched or transformed (e.g., trace logs correlation) before being exported to the available backends (e.g. Jaeger, AWS X-Ray, OpenZipkin). In this example, the collector runs as a standalone service, but it can be just as well deployed as a daemon process co-located with the instrumented service.
Exporters
The collector configuration receives a set of exporters that specify the backends to which collected telemetry is forwarded to. These exporters are just adapters that make third-party and OSS backend integration possible.
Propagators
To carry over the context from one service to another, the instrumentation libraries rely on propagators that inject and retrieve the context from the underlying carrier (e.g., specific headers in the HTTP request or Kafka record).
Backends
OpenTelemetry supports a great array of backends that stores all the collected telemetry data over time and allows you to derive insights from the monitored services. Jaeger, OpenZipkin, AWS X-Ray, and Honeycomb are examples of these services.
Putting it all together
To find out about the state of distributed tracing with OpenTelemetry using Kafka and Confluent services, such as ksqlDB, Kafka Connect, and Confluent Schema Registry, we put together the following scenario as an example:
Find all the GitHub users since 2019 who starred the repositories for Apache Kafka and Funding Circle’s Jackdaw—our thin wrapper around Kafka Streams for Clojure—over a period of 10 days, and expose the result in an API endpoint.
After instrumenting all the services, we should be able to visualize the Kafka producer and consumer requests in the Jaeger UI, depicting the service graph and the flow of events between services together with the latency associated with each request, as well as other metadata like destination topic.
One of the main points to evaluate is the behavior of auto instrumentation on stateful stream processing operations. This concern originates from the fact that Kafka headers—the medium where context for distributed traces are propagated—were not serialized to RocksDB until KIP-244 was addressed. Moreover, a mechanism to manipulate message headers on the outcomes of stateful operations is still a work in progress with KAFKA-7718. However, we are still keen on figuring out how far we can go with auto instrumentation.
Our solution for this problem includes the following steps:
- Source repository stars data from the GitHub API using Confluent’s GitHub source connector for Kafka Connect. We’ve created two separate connectors: one for Apache Kafka and one for Funding Circle’s Jackdaw library. The output will be streamed to the github-avro-stargazers-kafka and github-avro-stargazers-jackdaw topics, respectively. The sourced events look like this:
{ "type": "STARGAZERS", "createdAt": null, "data": { "login": "github_handler", "id": 12345678, "node_id": "MDQ6VXNlcjMzNTkwMzEx", "avatar_url": "<https://avatars2.githubusercontent.com/u/12345678?v=4>", "gravatar_id": "", "url": "<https://api.github.com/users/github_handler>", "html_url": "<https://github.com/github_handler>", "followers_url": "<https://api.github.com/users/github_handler/followers>", "following_url": "<https://api.github.com/users/github_handler/following{/other_user}>", "gists_url": "<https://api.github.com/users/github_handler/gists{/gist_id}>", "starred_url": "<https://api.github.com/users/github_handler/starred{/owner}{/repo}>", "subscriptions_url": "<https://api.github.com/users/github_handler/subscriptions>", "organizations_url": "<https://api.github.com/users/github_handler/orgs>", "repos_url": "<https://api.github.com/users/github_handler/repos>", "events_url": "<https://api.github.com/users/github_handler/events{/privacy}>", "received_events_url": "<https://api.github.com/users/github_handler/received_events>", "type": "User", "site_admin": false }, "id": "12345678" } - On top of ksqlDB, we are joining both topics, flattening the output to filter some information represented under the data field and changing the serialization from AVRO to JSON:
CREATE STREAM stargazers_kafka with (KAFKA_TOPIC='github-avro-stargazers-kafka', VALUE_FORMAT='AVRO');
CREATE STREAM stargazers_jackdaw with (KAFKA_TOPIC='github-avro-stargazers-jackdaw', VALUE_FORMAT='AVRO');
CREATE STREAM stargazers_aggregate WITH (kafka_topic='stargazers-results', value_format='json', partitions='1')
AS SELECT sgz.data->id AS id, sgz.data->login AS login, sgz.data->type AS type
FROM stargazers_kafka AS sgz
INNER JOIN stargazers_jackdaw AS sjack WITHIN 10 DAYS ON sgz.data->login=sjack.data->login
PARTITION BY sgz.data->id EMIT CHANGES;
- The final piece is a Golang service based on the Fiber web framework and confluent-kafka-go to evaluate the behavior between different Kafka clients and OpenTelemetry instrumentation libraries. This service consumes data from the stargazers-results topic and exposes it to the user via an HTTP endpoint. Unfortunately, we cannot find an auto-instrumentation solution for Golang and Kafka, so we have to implement the instrumentation manually as part of the service using the OpenTelemetry API.
So, what is the result in the Jaeger UI? As expected, the traces are broken due to the stateful join operation in ksqlDB, so we never get the end-to-end trace.
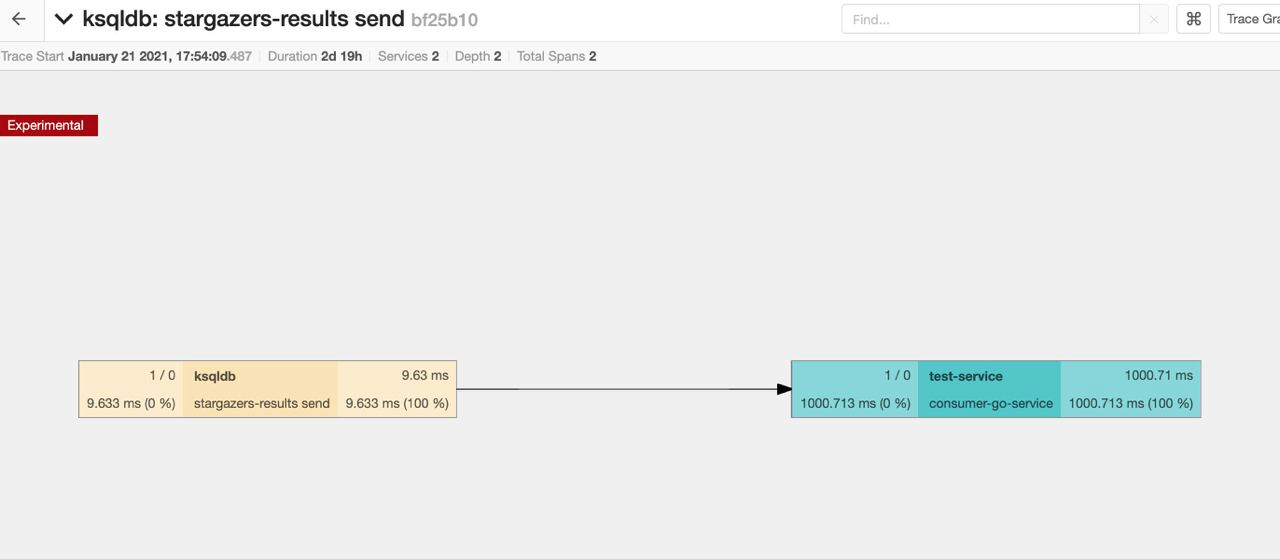
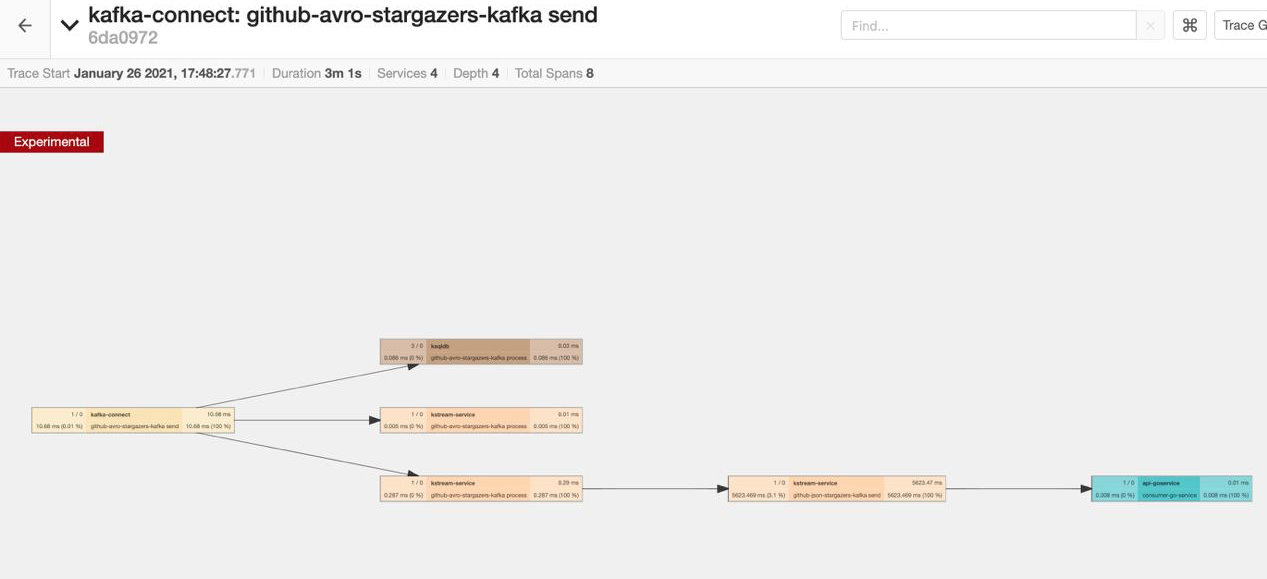
As a comparison, we’ve created a simple Kafka Streams service with a topology that just flattens the nested data and changes the encoding from AVRO to JSON. For this simple and stateless topology, auto instrumentation works as expected, and we can see the end-to-end traces.
All the code and documentation to follow and reproduce these steps can be found on GitHub.
Conclusion
Adding distributed tracing capabilities to our system at Funding Circle enables better observability, which can be leveraged in the form of increased “debug ability,” quicker incident response times, improved documentation distilled from service graphs, and better understanding of SLAs and SLOs for our services and its dependencies.
The OpenTelemetry observability suite provides the building blocks to collect telemetry data with minimum effort on the developer side via auto instrumentation. Although it is likely that some level of manual instrumentation will be required to track high-level business metrics, we believe the insights that can be obtained from non-intrusive, effortless instrumentation are worth the effort. Given how low the bar is for adding non-intrusive telemetry capabilities to an event streaming system using OpenTelemetry, our recommendation is for you to start with the approach described in this blog post. This will help you balance productivity and effort while maximizing your time. As you become acquainted with these new capabilities, you can then venture into other options, which may provide further flexibility and customization for your needs.
In this exploration of distributed tracing for Kafka-based, event-driven services, we detected stateful stream processing as the main limitation to achieving full end-to-end observability. However, given the awareness of the community (see KAFKA-7718) and the swiftness with which similar shortcomings have been quickly addressed, we feel optimistic about a fast resolution for this limitation.
To learn more about how we’re using Kafka at Funding Circle, check out the Kafka Summit talk Data-Oriented Programming with Clojure and Jackdaw.


