[Virtual Event] Agentic AI Streamposium: Learn to Build Real-Time AI Agents & Apps | Register
Kafka Connect Improvements in Apache Kafka 2.3
With the release of Apache Kafka® 2.3 and Confluent Platform 5.3 came several substantial improvements to the already awesome Kafka Connect. Not sure what Kafka Connect is or need convincing of its awesomeness? Didn’t realise that it’s part of Apache Kafka and solves all your streaming integration needs? Check out my Kafka Summit London talk: From Zero to Hero with Kafka Connect—and if you want to hear more talks like this, be sure to come to Kafka Summit San Francisco.
So herewith are some of the enhancements to Kafka Connect that caught my eye. At the top of the list has to be the change in how Kafka Connect handles tasks when connectors are added and removed. Previously, this was somewhat of a “stop the world” activity, which caused much wailing and gnashing of teeth amongst developers and operators. Whilst this is the headline act, there are several other real gems that address frequent requests from the Kafka Connect community.
Incremental Cooperative Rebalancing in Kafka Connect
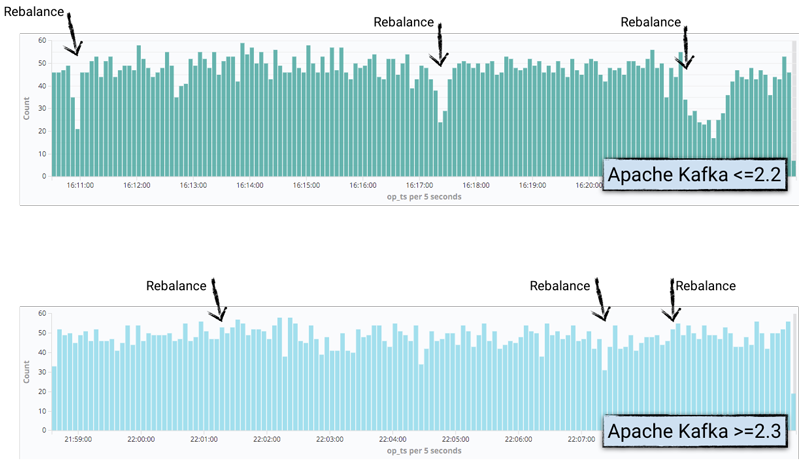
A Kafka Connect cluster is made up of one or more worker processes, and the cluster distributes the work of connectors as tasks. When a connector or worker is added or removed, Kafka Connect will attempt to rebalance these tasks. Before version 2.3 of Kafka, the cluster stopped all tasks, recomputed where to run all tasks, and then started everything again. Each rebalance halted all ingest and egress work for usually short periods of time, but also sometimes for a not insignificant duration of time.
Now with KIP-415, Apache Kafka 2.3 instead uses incremental cooperative rebalancing, which rebalances only those tasks that need to be started, stopped, or moved. For more details, there are available resources that you can read, listen, and watch, or you can hear the lead engineer on the work, Konstantine Karantasis, talk about it in person at the upcoming Kafka Summit.
To put it through its paces, I did a simple test with a handful of connectors. I’m using just a single distributed Kafka Connect worker. The source is using kafka-connect-datagen, which generates random data according to a given schema at defined intervals. The fact that it does so at defined intervals allows us to roughly determine the times during which the task was stopped due to rebalancing, since the generated messages have a timestamp as part of the Kafka message. These messages then get streamed to Elasticsearch—not just because it’s an easy sink to use but also because we can then visualise the timestamp of the source messages to look at any gaps in production.
To create the source, run the following:
curl -s -X PUT -H  "Content-Type:application/json" http://localhost:8083/connectors/source-datagen-01/config \
    -d '{
    "connector.class": "io.confluent.kafka.connect.datagen.DatagenConnector",
    "kafka.topic": "orders",
    "quickstart":"orders",
    "max.interval":200,
    "iterations":10000000,
    "tasks.max": "1"
  }'
To create the sink, run this:
curl -s -X PUT -H  "Content-Type:application/json" \
    http://localhost:8083/connectors/sink-elastic-orders-00/config \
    -d '{
        "connector.class": "io.confluent.connect.elasticsearch.ElasticsearchSinkConnector",
        "topics": "orders",
        "connection.url": "http://elasticsearch:9200",
        "type.name": "type.name=kafkaconnect",
        "key.ignore": "true",
        "schema.ignore": "false",
        "transforms": "addTS",
        "transforms.addTS.type": "org.apache.kafka.connect.transforms.InsertField$Value",
        "transforms.addTS.timestamp.field": "op_ts"
        }'
You’ll notice that I’m using a Single Message Transform to lift the timestamp of the Kafka message into a field of the message itself so that it can be exposed in Elasticsearch. From here, it’s plotted using Kibana to show where the number of records produced drops, in line with where the rebalances happen:

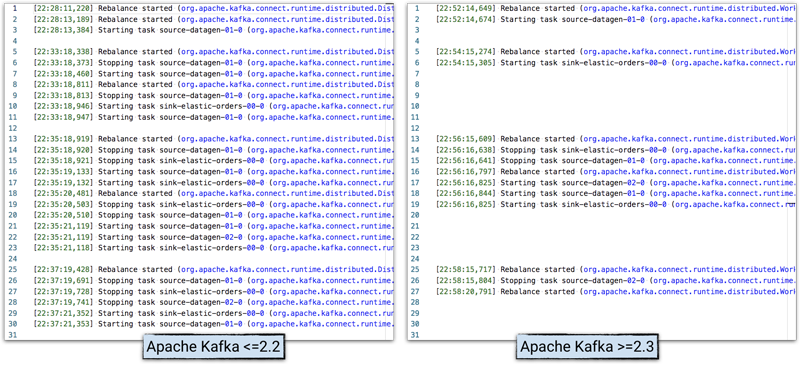
In the Kafka Connect worker log, it’s possible to see the activity and timings, and compare the behaviour of Apache Kafka 2.2 with 2.3.

Note: logs have been stripped of additional text to enable clearer illustration.
Logging improvements
Probably second in top frustrations with Kafka Connect behind the rebalance issue (which has greatly improved as shown above) is the difficulty in determining in the Kafka Connect worker log which message belongs to which connector.
Previously, you’d get messages in the log directly from a connector’s task, such as this:
INFO Using multi thread/connection supporting pooling connection manager (io.searchbox.client.JestClientFactory)
INFO Using default GSON instance (io.searchbox.client.JestClientFactory)
INFO Node Discovery disabled... (io.searchbox.client.JestClientFactory)
INFO Idle connection reaping disabled... (io.searchbox.client.JestClientFactory)
Which task are they for? Who knows. Maybe you figure out that JestClient has to do with Elasticsearch…maybe they’re from the Elasticsearch connector! But you’ve got five different Elasticsearch connectors running…so which instance are they from? And not to mention that connectors can have more than one task. Sounds like a troubleshooting nightmare!
With Apache Kafka 2.3, Mapped Diagnostic Context (MDC) logging is available, giving much more context in the logs:
INFO [sink-elastic-orders-00|task-0] Using multi thread/connection supporting pooling connection manager (io.searchbox.client.JestClientFactory:223)
INFO [sink-elastic-orders-00|task-0] Using default GSON instance (io.searchbox.client.JestClientFactory:69)
INFO [sink-elastic-orders-00|task-0] Node Discovery disabled... (io.searchbox.client.JestClientFactory:86)
INFO [sink-elastic-orders-00|task-0] Idle connection reaping disabled... (io.searchbox.client.JestClientFactory:98)
This change in logging format is disabled by default to maintain backward compatibility. To enable this improved logging, you need to edit etc/kafka/connect-log4j.properties and set the log4j.appender.stdout.layout.ConversionPattern as shown here:
log4j.appender.stdout.layout.ConversionPattern=[%d] %p %X{connector.context}%m (%c:%L)%n
Support for this has also been added to the Kafka Connect Docker images through the environment variable CONNECT_LOG4J_APPENDER_STDOUT_LAYOUT_CONVERSIONPATTERN.
For more details, see KIP-449.
REST improvements
KIP-465 adds some handy functionality to the /connectors REST endpoint. By passing additional parameters, you can get back more information about each connector instead of having to iterate over the results and make additional REST calls.
For example, to find out the state of all tasks before Apache Kafka 2.3, you’d have to do something like this, using xargs to iterate over the output and call the status endpoint repeatedly:
$ curl -s "http://localhost:8083/connectors"| \
    jq '.[]'| \
    xargs -I{connector_name} curl -s "http://localhost:8083/connectors/"{connector_name}"/status"| \
    jq -c -M '[.name,.connector.state,.tasks[].state]|join(":|:")'| \
    column -s : -t| sed 's/\"//g'| sort
sink-elastic-orders-00  |  RUNNING  |  RUNNING
source-datagen-01       |  RUNNING  |  RUNNING
Now with Apache Kafka 2.3, you can use /connectors?expand=status to make a single REST call with some jq magic to munge the results into the same structure as before:
$ curl -s "http://localhost:8083/connectors?expand=status" | \
     jq 'to_entries[] | [.key, .value.status.connector.state,.value.status.tasks[].state]|join(":|:")' | \
     column -s : -t| sed 's/\"//g'| sort
sink-elastic-orders-00  |  RUNNING  |  RUNNING
source-datagen-01       |  RUNNING  |  RUNNING
There’s also /connectors?expand=info, which will return for each connector information like the configuration, type of connector, and so on. You can combine them too:
$ curl -s "http://localhost:8083/connectors?expand=info&expand=status"|jq 'to_entries[] | [ .value.info.type, .key, .value.status.connector.state,.value.status.tasks[].state,.value.info.config."connector.class"]|join(":|:")' | \
       column -s : -t| sed 's/\"//g'| sort
sink    |  sink-elastic-orders-00  |  RUNNING  |  RUNNING  |  io.confluent.connect.elasticsearch.ElasticsearchSinkConnector
source  |  source-datagen-01       |  RUNNING  |  RUNNING  |  io.confluent.kafka.connect.datagen.DatagenConnector
Kafka Connect now sets client.id
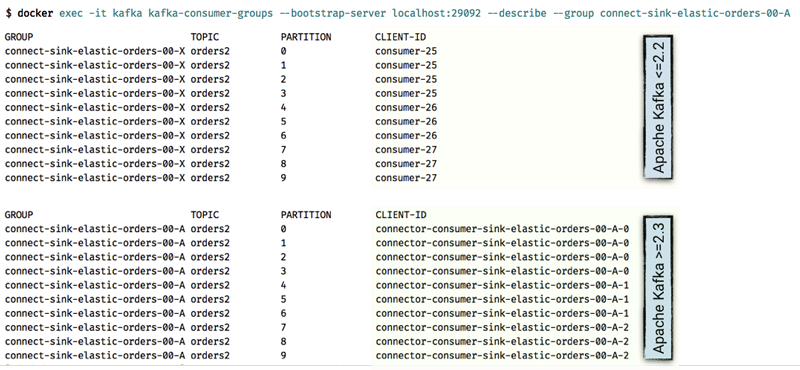
Thanks to KIP-411, Kafka Connect now sets client.id in a more helpful way per task. Whereas before you could only see that consumer-25 was consuming from a given partition as part of the connector’s consumer group, now you can tie it directly back to the specific task, making troubleshooting and diagnostics much easier.

Connector-level producer/consumer configuration overrides
A common request over the years is the ability to override the consumer settings or producer settings used by Kafka Connect sinks and sources, respectively. Until now, they have taken the values specified in the worker configuration, making granular refinement of things, such as security principals, impossible to do without simply spawning more workers.
The implementation of KIP-458 in Apache Kafka 2.3 enables a worker to permit overrides to configuration. connector.client.config.override.policy is a new setting with three permitted values that needs to be set at the worker level:
| Value | Description |
| None | Default policy. Disallows any configuration overrides. |
| Principal | Allows override of security.protocol, sasl.jaas.config, and sasl.mechanism for the producer, consumer, and admin prefixes. |
| All | Allows override of all configurations for the produce, consumer, and admin prefixes. |
With the above configuration set in the worker configuration, you can now override settings on a per-connector basis. Simply supply the required parameter with a prefix of consumer.override (Sinks) or producer.override (Sources). You can also use admin.override for dead letter queues.
In this example, when the connector is created, it will consume data from the latest point in the topic rather than reading all of the available data in the topic, which is the default behaviour for Kafka Connect. This is done by overriding the auto.offset.reset configuration using
"consumer.override.auto.offset.reset": "latest".
curl -i -X PUT -H  "Content-Type:application/json" \
      http://localhost:8083/connectors/sink-elastic-orders-01-latest/config \
      -d '{
  "connector.class": "io.confluent.connect.elasticsearch.ElasticsearchSinkConnector",
  "topics": "orders",
  "consumer.override.auto.offset.reset": "latest",
  "tasks.max": 1,
  "connection.url": "http://elasticsearch:9200",  "type.name": "type.name=kafkaconnect",
  "key.ignore": "true",   "schema.ignore": "false",
  "transforms": "renameTopic",
  "transforms.renameTopic.type": "org.apache.kafka.connect.transforms.RegexRouter",
  "transforms.renameTopic.regex": "orders",
  "transforms.renameTopic.replacement": "orders-latest"
}'
By examining the worker log, we can see that the override is picked up:
[2019-07-17 13:57:27,532] INFO [sink-elastic-orders-01-latest|task-0] ConsumerConfig values:
        allow.auto.create.topics = true
        auto.commit.interval.ms = 5000
        auto.offset.reset = latest
[…]
We can see that this ConsumerConfig log entry specifically relates to the connector we’ve created, demonstrating the usefulness of the MDC logging described above.
A second connector is running from the same topic but with no consumer.override, thus inheriting the default worker value of earliest:
[2019-07-17 13:57:27,487] INFO [sink-elastic-orders-01-earliest|task-0] ConsumerConfig values:
        allow.auto.create.topics = true
        auto.commit.interval.ms = 5000
        auto.offset.reset = earliest
[…]
The impact of this difference can be examined in the work that we’ve configured it to do by streaming data from the topic to Elasticsearch.
$ curl -s "localhost:9200/_cat/indices?h=idx,docsCount"
orders-latest     2369
orders-earliest 144932
There are two indices: one clearly with fewer records despite being populated from the same topic, as the orders-latest index is populated by the connector only streaming records from the topic that arrive after the connector was created; the orders-earliest index, on the other hand, is populated by a separate connector that uses the Kafka Connect default of streaming all new messages, along with all the messages that were in the topic already.
Summary
I think you will agree that this is a fine set of useful improvements to Kafka Connect. If you’ve got data to get into Kafka, or data to stream from Kafka to somewhere else, you should almost certainly be using Kafka Connect—made easier and faster with this release.
Interested in more?
If you’d like to know more, you can download the Confluent Platform to get started with these improvements and the leading distribution of Apache Kafka.
Avez-vous aimé cet article de blog ? Partagez-le !
Abonnez-vous au blog Confluent
From Dumb Pipes to a Smart Data Plane: Introducing Schema IDs in Apache Kafka® Headers
Confluent’s Schema IDs in headers transform Kafka from "dumb pipes" to a "smart data plane." By moving metadata out of payloads, teams can schematize topics without breaking legacy apps or requiring big-bang migrations. This unlocks governed, AI-ready data for Flink and lakehouses with ease.
Queues for Apache Kafka® Is Here: Your Guide to Getting Started in Confluent
Confluent announces the General Availability of Queues for Kafka on Confluent Cloud and Confluent Platform with Apache Kafka 4.2. This production-ready feature brings native queue semantics to Kafka through KIP-932, enabling organizations to consolidate streaming and queuing infrastructure while...

