Nouveau dans Confluent Cloud : rendre les données et les pipelines accessibles pour un streaming prêt pour l’IA | En savoir plus
99th Percentile Latency at Scale with Apache Kafka
Fraud detection, payment systems, and stock trading platforms are only a few of many Apache Kafka® use cases that require both fast and predictable delivery of data. For example, detecting fraud for online banking transactions has to happen in real time in order to deliver business value, without adding more than 50—100 ms of overhead to each transaction in order to maintain a good customer experience.
In Kafka terms, data delivery time is defined by end-to-end latency—the time it takes for a record produced to Kafka to be fetched by the consumer. Latency objectives are expressed as both target latency and the importance of meeting this target. For instance, your latency objective could be expressed as: “I would like to get 99th percentile end-to-end latency of 50 ms from Kafka.”
This adds to your availability, durability, and throughput goals. Achieving high durability and high throughput have known latency trade-offs. The challenge is to scale an application for throughput while keeping bounds on latency, and to size your Kafka cluster to handle client and replication load with acceptable broker latencies. Since latency also depends on your choice of hardware or cloud provider, you need to be able to monitor and tune your clients to achieve your specific latency goals in your unique environment.
We have written a white paper with a comprehensive list of guidelines for configuring your Kafka deployment to optimize for various goals. This post will help you further by gaining a better intuition and understanding of end-to-end latency, and configuring and scaling your application for throughput while keeping bounds on latency.
Understanding Kafka end-to-end latency
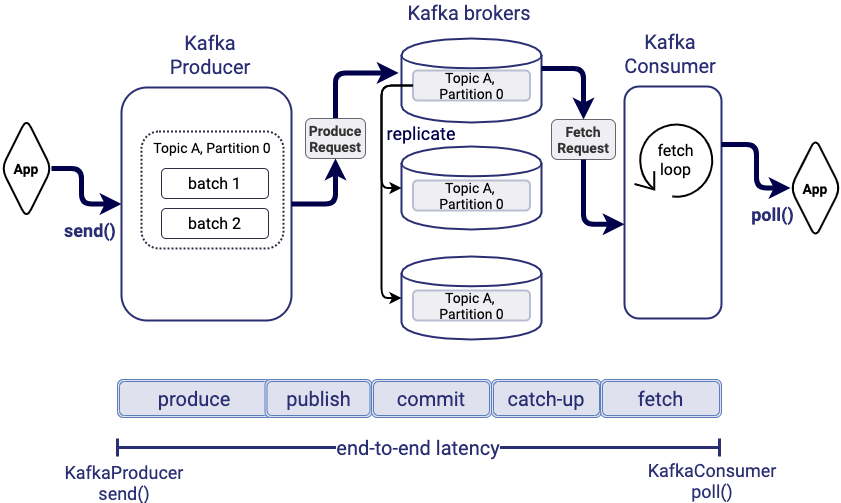
End-to-end latency is the time between when the application logic produces a record via KafkaProducer.send() to when the record can be consumed by the application logic via KafkaConsumer.poll(). The figure below shows the path of a record through the system, from the internal Kafka producer to Kafka brokers, being replicated for fault tolerance, and getting fetched by the consumer when the consumer gets to its position in the topic partition log. We define five major components of end-to-end latency:
- Produce time: processing the record and batching with other records in the internal Kafka producer
- Publish time: sending the record from Kafka producer to broker and appending the record to the leader replica log
- Commit time: replicating the record to follower replicas for fault tolerance
- Catch-up time: catching up to the record’s offset in the log
- Fetch time: fetching the record from the broker
In the next few paragraphs, we will explain where time is spent in each component to get a sense of likely causes for increased latency. Specific client configurations or application design techniques often impact end-to-end latency, and it is useful to pinpoint which factor has the greatest effect.
Produce time: Record processing and batching delays in Kafka producer
Produce time refers to the time between when the application logic produces a record via KafkaProducer.send() to when the produce request containing the record is sent to the leader broker of the topic partition. A Kafka producer batches records for the same topic partition to optimize network and IO requests issued to Kafka. By default, the producer is configured to send the batch immediately, in which case the batch usually contains one or a few records produced by the application at about the same time. To improve batching, the producer can be configured with a small amount of artificial delay (linger.ms) that the record will spend waiting for more records to arrive and get added to the same batch. Once the linger.ms delay has passed or the batch size reaches the maximum configured size (batch.size), the batch is considered complete.
If compression is enabled (compression.type), the Kafka producer compresses the completed batch. Before batch completion, the size of the batch is estimated based on a combination of the compression type and the previously observed compression ratio for the topic.
The batch may need to wait longer in the producer if the number of unacknowledged produce requests sent to the leader broker has already reached the maximum (max.inflight.requests.per.connection), which is five by default. Thus, the faster the broker acknowledges produce requests, the smaller the chance of an additional wait time in the producer.
Publish time: Sending and appending the record to the leader replica
Publish time is the time between when the internal Kafka producer sends a produce request to the broker, to when the corresponding message gets appended to the leader replica log. When the request arrives to the broker, the network thread responsible for the connection picks up the request and places it in the request queue. One of the request handler threads picks up requests from the queue and processes them. Thus, publish time includes network time of the produce request, queueing time at the broker, and the time it takes to append the message to the log (most often, this is page cache access time). When the brokers are lightly loaded, network and log append time dominate publish time. As brokers become more loaded, queueing delays increasingly dominate publish time.
Commit time: Replicating the record from leader to followers
Commit time is the time it takes to replicate the message to all in-sync replicas. Kafka only exposes messages to the consumer after they have been committed, that is, replicated to all in-sync replicas for fault tolerance. The followers replicate messages from the leader in parallel, and we normally do not expect replicas to be out of sync in a healthy cluster. This means that the time it takes to commit the record equals the time it takes for the slowest in-sync follower broker to fetch the record from the leader broker and append it to the follower replica log.
To replicate data, follower brokers send the leader fetch requests, the exact same type of requests that consumers use to fetch messages. The broker default configuration is optimized for latency of replica fetch requests: the leader sends the response as soon as a single byte is available for fetching (controlled by replica.fetch.min.bytes) or when replica.fetch.wait.max.ms delay is up. Commit times are mainly impacted by the replication factor configuration and cluster load.
Catch-up time: Catching up to the record’s offset in the log
Messages in Kafka are consumed in the order they are produced, unless there is an explicit seek to a new offset or a new consumer reading from the latest offset. A consumer will only read the record in question after it reads all previously published records to the same topic partition. Suppose that at the time the message was committed, the consumer’s offset was N messages behind the committed message. Catch-up time, in this case, is the time it takes to consume N messages.
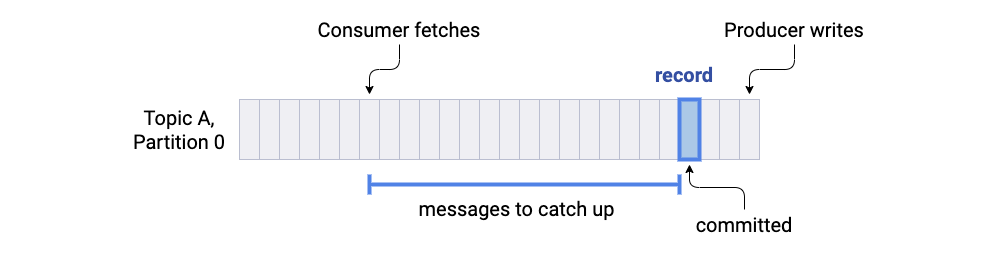
When you build real-time use cases, it is better to aim for zero catch-up time where consumers read messages as soon as they are committed. If consumers consistently fall behind, end-to-end latency may become unbounded. Thus, catch-up time mostly depends on the ability of consumers to keep up with the produce throughput.
Fetch time: Fetching the record from the broker
The consumer subscribed to a topic partition continuously polls the leader broker for more data. Fetch time is the time it takes to fetch the record in question from the leader broker, potentially waiting for enough data to form the response to the fetch request and return the record in the response from KafkaConsumer.poll(). The default consumer configuration is optimized for latency (fetch.min.bytes is set to one), where the response to a fetch request is returned as soon as a single byte of data is available, or after a timeout (fetch.max.wait.ms).
End-to-end latency vs. producer and consumer latencies
The figure below shows how latencies observed by Kafka clients, usually called producer latency and consumer latency, relate to end-to-end latency. Producer latency is the time between KafkaProducer.send() and the acknowledgement of the produced record. The record is acknowledged based on acks configuration, which controls the durability of records:
- Immediately without waiting for a reply from a broker (acks = 0)
- After appending the message to the leader (acks = 1)
- After all in-sync replicas receive the message (acks = all)
As a result, producer latency includes produce time, publish time (if acks ≥ 1), commit time (if acks = all), and the time it takes to send the produce response from broker back to producer.
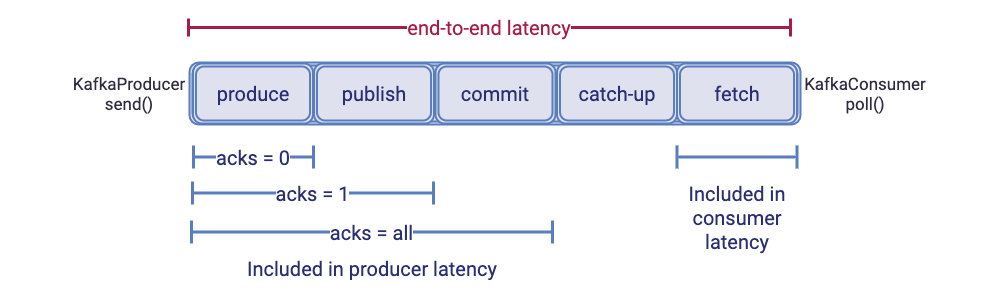
This diagram makes it clear why changing the acks configuration reduces producer latency by removing one or more latency components (publish and commit) from the producer latency. Publish and commit times are always part of end-to-end latency independent of the producer acks configuration.
Consumer latency is how long it takes to send a fetch request to the broker and for the broker to return the response to the consumer. It is measured as the time it takes for KafkaConsumer.poll() to return. Consumer latency includes the fetch component of the end-to-end latency.
Bounding end-to-end latency
If we consider the lifetime of an individual message, bounding end-to-end latency is about bounding delays that a message can encounter while moving through the system. Many of the Kafka client and broker configuration parameters have default settings that already optimize for latency by minimizing the artificial delays that can be set to improve batching (linger.ms, fetch.min.bytes, and replica.fetch.min.bytes). Other delays may come from queueing delays on brokers, and bounding latency may require bounding per-broker load (CPU or throughput).
If we consider the system as a whole, bounding end-to-end latency also requires that each layer of the system (producers, brokers, and consumers) can reliably sustain the amount of throughput required by the application logic. For example, if your application logic sends 100 MB/second but, for some reason, your Kafka consumer throughput drops to 10 MB/second for a couple of seconds, most of the messages produced just before that need to wait longer in the system until the consumers catch up. You want to scale your Kafka clients for throughput in a way that efficiently utilizes broker resources to minimize both queueing delays and occasional congestion.
Bounding latencies in the most ideal sense means ensuring that all latencies are below the target. In practice, such a hard guarantee is not possible due to unexpected failures and peak loads. It is possible, however, to design your application and tune the system to achieve your target 95–99th percentile latencies, thus bounding latencies for 95–99% of all messages. High-percentile latencies are also called tail latencies, as they are the tail end of the latency spectrum.
The higher your target percentile, the more tuning is needed to either minimize or account for the worst-case behavior of your application. For example, an occasional large request may block all requests behind it, increasing their latencies, which is known as head-of-line blocking. A large number of low-rate clients may occasionally happen to send produce/fetch requests to Kafka at the same time or all refresh their metadata, causing deeper-than-usual request queues and larger tail latencies. This behavior is known as micro-bursting.
The rest of this blog post discusses each of these points in more detail.
Experimental setup for evaluating different client configurations on latency
Throughout this post, we use experimental results to illustrate the impact of Kafka client configurations and throughput scaling techniques on performance. We used Apache Kafka’s built-in Trogdor test framework as well as its produce and consume benchmarks, ProduceBench and ConsumeBench, for our produce and consume experiments.
All our tests ran on a nine-broker Kafka cluster with a replication factor of three, which guarantees no message loss in the presence of up to two simultaneous node failures. Kafka brokers ran on Amazon Web Services (AWS) r5.xlarge instances with 2 TB of ST1 Amazon Elastic Block Storage (EBS). Kafka brokers were distributed across three availability zones (AZ) within the same region for stronger fault tolerance, where each topic partition replica was placed on a different AZ. Kafka clients were configured to use SASL authentication and SSL encryption, while inter-broker communication used PLAINTEXT.
Unless otherwise noted, our experiments used the following non-default client configurations and other specifications:
| Replication factor | 3 |
| Number of topic partitions | 108 |
| security.protocol | SASL_SSL |
| sasl.mechanism | PLAIN |
| acks | all |
| linger.ms | 5 |
| compression.type | lz4 |
| Producer record size | value = 512 bytes key = 4 bytes |
| Trogdor record value generator | uniformRandom |
| Trogdor record key generator | sequential |
| Number of Trogdor agents | 9 |
This scenario does introduce additional latency: multi-AZ setup increases commit time due to cross-AZ replication. SSL adds encryption overhead on both clients and brokers and additional overhead to consumer fetching because SSL cannot leverage zero-copy data transfer using sendfile. While such a fault-tolerant and secure setup compromises latency, we chose it to represent a practical, real-world scenario.
Impact of durability configuration on latency
When stacking up your latency objectives against your other requirements, it is useful to consider your durability requirements first. Some level of durability is often required because of the criticality of your data. Optimizing for durability increases end-to-end latency because it adds replication overhead (commit time) to latency and adds replication load to the brokers, which increases queueing delays.
Replication factor
Replication factor is at the core of Kafka’s durability guarantees, which defines the number of copies of the topic in a Kafka cluster. A replication factor of rf allows you to lose (rf – 1) brokers without losing your data. A replication factor of one achieves minimal end-to-end latency while providing the weakest durability guarantees.
Increasing replication factor adds replication overhead and increases the load on brokers. If client bandwidth is distributed evenly among Kafka brokers, each broker will get rf * w write bandwidth and r + (rf – 1)*w read bandwidth, where rf is the replication factor, w is the client produce bandwidth per broker, and r is the client consume bandwidth per broker. Therefore, the best way to minimize the impact of replication factor on end-to-end latency is to ensure evenly loaded brokers. This will reduce commit time, which is defined by the slowest follower replica, and reduce tail latencies due to decreased variance among broker latencies.
If your Kafka brokers are highly utilized either on disk bandwidth or CPU, followers may start lagging behind the leaders, increasing commit times. We suggest configuring a separate listener for replication traffic on brokers (KIP-103) to reduce interference with client traffic. You can also increase the degree of I/O parallelism on the follower broker, and increase the number of replica fetcher threads per source broker (number.replica.fetchers), which is one by default.
Acks
Even if we configure brokers with multiple replicas, producers must also be configured for reliability via the acks configuration. Setting acks to all provides the strongest guarantee but also increases the time it takes the broker to acknowledge the produce request, as we discussed earlier.
Slower acknowledgements from brokers usually decrease the throughput that can be achieved by a single producer, which in turn increases the wait time in the producer. This is due to the producer limit (max.inflight.requests.per.connection) on the number of unacknowledged requests sent to the broker. For example, nine producers (ran with nine consumers) that were able to produce 195 MB/second (throughput of the produce logic) to Kafka with acks=1 in our setup, produced 161 MB/second to Kafka after changing acks to all. Increasing acks often requires additional scaling of producers to ensure they can keep up with your application logic in order to both achieve your required total throughput and minimize wait time in the internal Kafka producer.
Min.insync.replicas
Min.insync.replicas is an important durability configuration, because it defines the number of replicas that have to be in sync for the broker to accept writes for the partition. This configuration impacts availability, but it does not impact end-to-end latency. The message has to be replicated to all replicas that are in sync with the leader regardless of the min.insync.replicas configuration. Thus, choosing a smaller min.insync.replicas does not reduce commit time or latency as a result.
Scaling throughput with latency objectives
Latency-throughput trade-off
Optimizing Kafka clients for throughput means optimizing batching. One type of batching is done by internal Kafka producers, which accumulate multiple records into a single batch. Each batch of records is compressed together and appended to and read from the log as a single unit. This means that data is also replicated and consumed in batches. Batching reduces the cost of each record by amortizing costs on both the clients and brokers. Generally, bigger batches reduce processing overhead and reduce network and disk IO, which improves network and disk utilization.
Another type of batching is collecting multiple record batches into a single network request-response to reduce the number of network requests required to transfer the same amount of data. This reduces request-response processing overhead on clients and brokers.
Bigger batches benefit both throughput and latency. Bigger batches result in better network, CPU, and disk utilization, which optimizes the amount of throughput you can get from the same Kafka cluster. Bigger batches reduce end-to-end latency, because a reduced per-record cost enables the system to process the same number of records in less amount of time.
The latency-throughput trade-off here is that the ability to batch more records together often requires increasing artificial delays on the message path. At some point, the increase in artificial delays may exceed the latency gains you would get from batching. As a result, your latency objectives may limit the amount of batching you can achieve, which may reduce the effective amount of throughput you can get from your brokers and increase broker latencies, as discussed above. If this results in insufficient available throughput or end-to-end latency, you can “buy” more throughput or processing power by expanding your cluster.
Configuring Kafka producers and consumers for batching
On the producer side, batching is controlled by two configuration parameters: batch.size (default is 16 KB), which limits the size of the batch, and linger.ms (default is 0 ms), which limits the amount of the delay. If your application sends records to the internal Kafka producer with a high rate, the batches may fill up to the maximum even with linger.ms = 0. If the application rate is low, increasing batching requires increasing linger.ms.
On the consumer side, you can adjust the amount of data the consumer receives in each fetch response by tuning fetch.min.bytes (default is one), which specifies the minimum amount of data the broker should return in the fetch response, and the timeout on waiting for the data controlled by fetch.max.wait.ms (default is 500 ms). More data in fetch responses leads to less fetch requests. Batching on the producer side indirectly impacts both the number of produce and fetch requests, since the batch defines the minimum amount of data that can be fetched.
Notice that by default, Kafka producers and consumers are configured with no artificial delay to optimize for latency. However, even if your goal is to minimize latency, we recommend considering a higher linger.ms, 5—10 ms, in the following scenarios:
- If you scaled your producer clients such that the produce rate from your application logic to each producer is low (lower or similar to the produce request rate to the broker), then your batches will only contain one or a few records. If your total throughput is high enough, you may overwhelm your Kafka cluster with requests, causing queuing delays and therefore increasing latency. Setting a small amount of artificial delay on the producer may actually improve overall latency.
- If you care about tail latencies, increasing linger.ms may reduce the request rate and the size of request bursts that can arrive to brokers at the same time. The bigger the burst, the higher the latency of the requests in the tail of the burst. These bursts determine your tail latencies. Therefore, increasing linger.ms may significantly reduce your tail latencies, even though your average latency may increase by the additional amount of the artificial delay in the producer.
The following experiment illustrates both scenarios. We ran 90 producers producing records to one topic with 108 partitions. The total produce throughput was capped to 90 MB/second. We ran three experiments, each corresponding to a different producer configuration. The graph below shows 50th and 99th percentile producer latency for each experimental run. Since we used acks=all, producer latency includes produce, publish, and commit times.
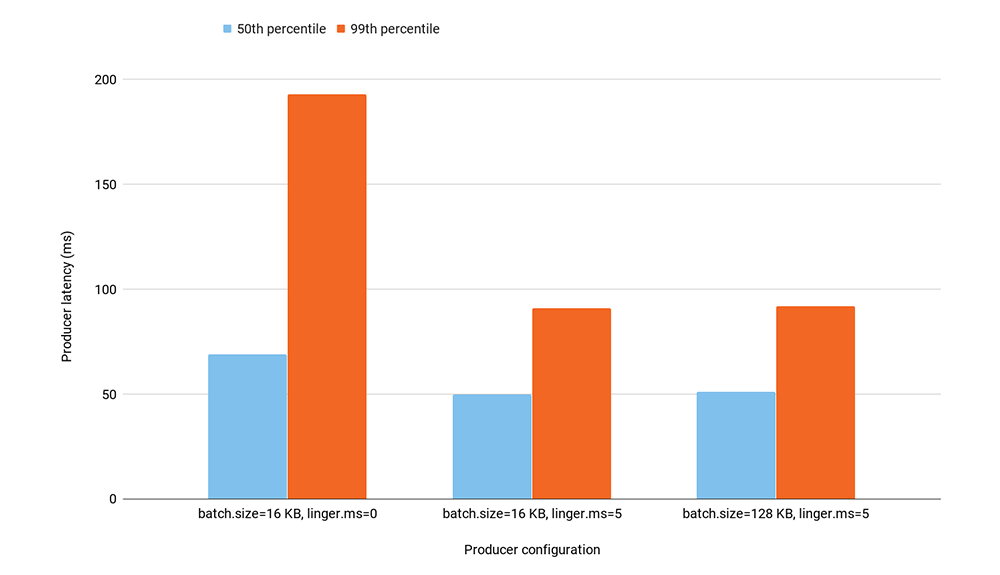
Since we had a relatively large number of producers for the given total produce throughput, linger.ms = 0 resulted in almost no batching of records on the producer side. Increasing linger.ms from 0 to just 5 ms significantly improved batching: the number of produce requests to Kafka decreased from 2,800 to 1,100. This reduced both the 50th and 99th percentile producer latency, but the impact on 99th percentile latency was much more significant.
Increasing the maximum batch size (batch.size) does not directly impact wait time on the producer, because the producer does not wait longer than linger.ms to fill up the batch. In our experiment, increasing batch.size from 16 KB to 128 KB did not increase batching since per-producer throughput was quite low. As expected, the producer latency did not change between the two configurations.
To summarize, if your goal is to minimize latency, we recommend keeping the default client batching configurations and possibly increasing linger.ms if producers are not able to batch records due to low per-producer throughput. If you have tail latency goals, it is better to optimize batching (while being within your latency target) in order to decrease request rate and the chance of large request bursts.
Improving batching without increasing artificial delays
Another reason for poor batching is when each producer sends messages to a large number of topic partitions. If records are not sent to the same partition, they cannot form a batch together. Therefore, it is often more beneficial to design your application such that each producer produces messages to a subset of partitions.
Also, consider upgrading to the Kafka 2.4 producer, which includes a new sticky partitioner implementation (KIP-480). The sticky partitioner improves batching for non-keyed topics without artificially delaying requests. See our blog post for benchmark results showing latency improvements in comparison to the default partitioner.
Impact of number of clients on tail latency
More clients generally lead to more load on brokers, even if the total produce and consume throughput remains the same. This is because more clients lead to more metadata requests to Kafka and more overhead on brokers to maintain more connections.
More clients have a bigger impact on tail latency compared to median or average latency. Each producer sends at most the configured number (max.inflight.requests.per.connection) of produce requests per broker at a time, and each consumer sends one fetch request per broker at a time. More clients increase the number of produce and fetch requests that can be sent to Kafka at a time, which increases the chance and the size of the request burst, increasing tail latencies.
The number of consumers are often determined by the number of your topic partitions and the goal of keeping consumers consistently caught up. However, it is often easy to end up with the large number of producers for application design reasons or trying to scale up throughput. Adding more producers for throughput reasons may have the opposite effect, because producers may lead to less batching due to each producer receiving records with a lower rate and having to wait longer to accumulate the same amount of records per batch.
In our experiment, we increased the number of producers from 90 to 900 while maintaining the same 90 MB/second total throughput from an application logic. We used a batch.size of 16 KB, linger.ms of five, and acks=all producer configuration. The graph below shows producer latencies from each of the three experimental runs.
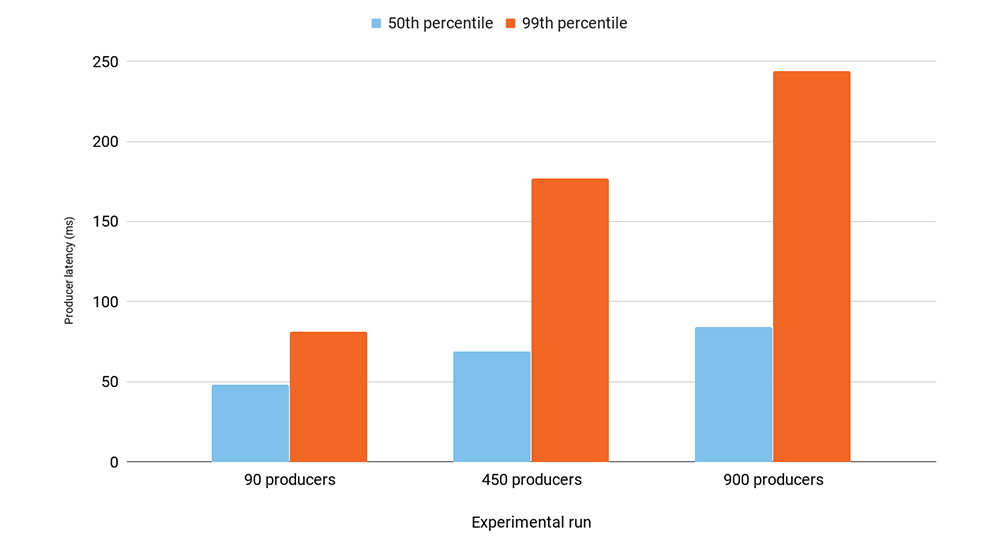
The results show that increasing the number of producers from 90 to 900 increased the median latency by 60% while the 99th percentile latency tripled. The increase in latency was caused by less batching on producers. The increase in tail latencies was due to larger request bursts, which raised both broker latencies and the chance of a longer wait time on producers due to waiting for acknowledgements. With 900 producers, the brokers were completely overwhelmed with requests. They spent most of their time on request processing, causing almost 100% CPU utilization on brokers on our nine-node Kafka cluster. Also keep in mind that our experiments use SSL, which has higher per-request overhead than having no security.
If you are adding producers to improve throughput, consider increasing your per-producer throughput by improving batching via techniques we discussed earlier. You may also end up with a large number of producers for application design reasons. For example, a large organization that collects metrics from its devices may easily have 100,000 devices. In this case, consider using proxies that collect requests from many clients and turn them into more efficient produce requests to Kafka. You can also add more brokers to bound per-broker request load.
Additional notes on scaling the consumers
When scaling consumers, keep in mind that all consumers in the same consumer group send offset commits and heartbeats to one broker, which acts as a consumer coordinator. More consumers in the consumer group increase the offset commit rate if offset commits are done on time intervals (auto.commit.interval.ms). Offset commits are essentially produce requests to the internal __consumer_offsets topic. Therefore, increasing the number of consumers in a consumer group may lead to additional request load on one broker, especially if commit intervals are configured to be small.
Impact of compression configuration
By default, Kafka producers are configured with no compression and are controlled by the compression.type configuration parameter. Compression adds processing overhead on the producer side to compress the message, processing overhead on brokers to decompress the message for validation before appending it to the log, and overhead on the consumer side to decompress the message. The broker’s compression should be set to “producer” in order to save the recompression cost, in which case the broker appends the original compressed message sent by the producer.
Although compression increases processing overhead, it may reduce overall end-to-end latency because it can significantly reduce the amount of bandwidth required to process your data, which reduces per-broker load. Since compression is done on batches, better batching usually means better compression.
More partitions may increase latencies
A topic partition is a unit of parallelism in Kafka. Messages to different partitions can be sent in parallel by producers, written in parallel to different brokers, and read in parallel by different consumers. Therefore, more partitions usually lead to more throughput. Purely from a throughput perspective, you should be able to get the full throughput from a Kafka cluster with an order of 10 partitions per broker. You may need more topic partitions to support your application logic.
Too many partitions may have a negative effect on end-to-end latency. More partitions per topic generally lead to less batching on producers. More topic partitions per broker lead to more overhead per replica follower fetch request. Each fetch request has to enumerate partitions the follower is interested in, and the leader has to examine the state and fetch data from each partition in the request, generally leading to smaller disk IO. Therefore, too many partitions may lead to large commit times and a high CPU load on brokers, resulting in longer queueing delays.
Increased commit times and a higher CPU load lead to increased end-to-end latency for all clients sharing the same Kafka cluster, even those who produce and consume to a small number of topic partitions.
Consider this experiment with two topics. One topic had nine producers sending 5 MB/second and one corresponding consumer group with nine consumers. The experiment ran for several days, and we increased the number of partitions in this topic from 108 to 7,200 (8,000 per broker) in steps, in which each step ran for one hour. The second topic had nine partitions during the whole experimental run and nine producers, each producing messages to one partition and one corresponding consumer group with nine consumers (one per partition). Producers to this topic produced one 512-byte record per second.
The graph below shows the impact of the number of partitions on the 99th percentile end-to-end latency of clients accessing the nine-partition topic. As the total number of partitions per broker grew (top graph), the end-to-end latency of the nine-partition topic clients also grew linearly (bottom graph). The increase in the number of partitions increased CPU load on brokers and slowed down replication for all clients, even for the clients that maintained constant partition counts, which raised end-to-end latency.
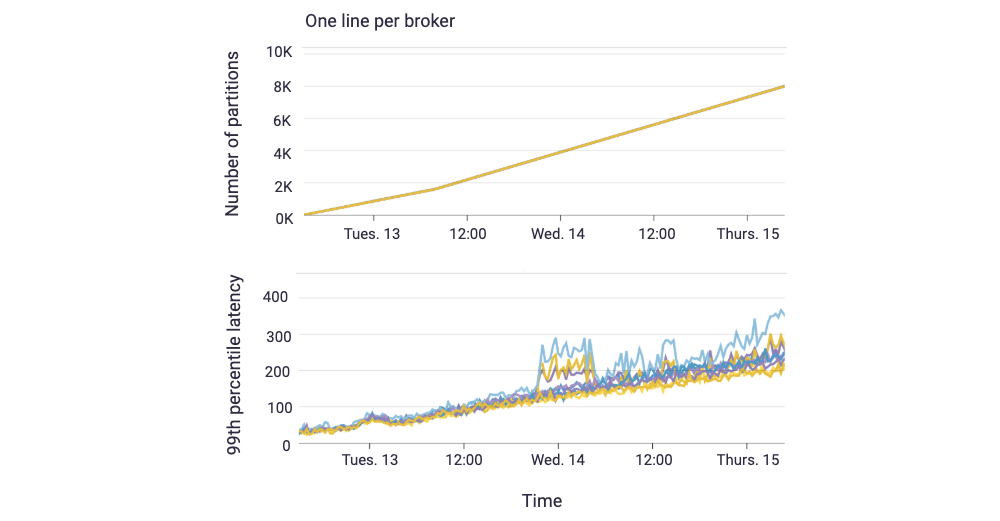
To decrease latencies, it is better to limit the number of partitions per broker either by decreasing your total number of topic partitions or expanding the cluster. You may also be able to improve commit times by increasing the number of replica fetcher threads per broker. This blog post provides more details on how to choose the number of topic partitions in a Kafka cluster.
Impact of broker load on latencies
We have discussed how more load on brokers increases queueing delays, which raises end-to-end latencies. It is easy to see why an increase in request rate worsens queueing delays since more requests lead to larger queues.
High resource utilization on brokers, disk, or CPU also leads to higher queueing delays, and delays grow exponentially with increases in resource utilization. This is a known property explained by queueing theory: Kingman’s formula shows that the wait time for a resource is proportional to (% of time resource is busy)/(% of time resource is idle).
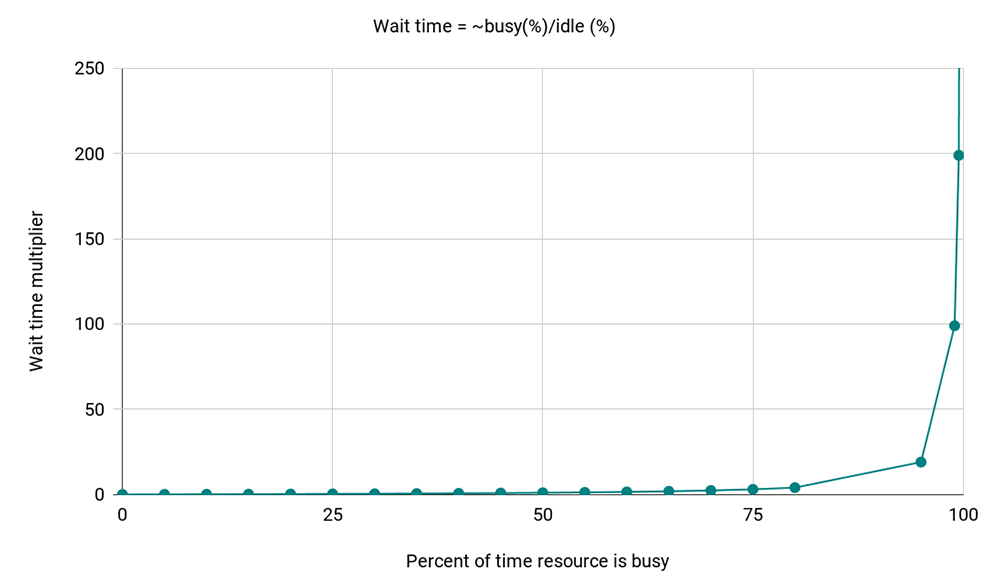
Since latency exponentially grows with resource utilization, you may see high latencies if any of the resources in brokers are close to 100% utilization. Reducing resource utilization per broker by either reducing resource usage (e.g., reducing the number of connections, requests, and partitions per broker) or expanding the cluster may significantly reduce your latencies in this case. It is also useful to keep load across the brokers even, especially for bounding tail latencies, by distributing partition replicas evenly or based on their load.
If you are using Confluent Cloud, you do not need to worry about maintaining a normal broker load—we do it for you. We automatically detect high resource utilization (disk and CPU) on brokers, and either rebalance partitions on the cluster to redistribute the load among brokers more evenly or expand the cluster if needed.
Summary
We have demonstrated that bounding latency while scaling clients and partitions for throughput requires restricting per-broker resource usage by limiting the number of connections, number of partitions, and the request rate per broker. Bounding tail latencies requires the additional care of minimizing any bursts (connections and requests) from clients or variance in your application behavior. Evenly loaded brokers are also important for minimizing tail latency, since it is impacted by the slowest broker.
Here is a list of additional reading material that may be useful for controlling latencies:
- Optimizing Your Apache Kafka Deployment provides guidelines for configuring your Kafka deployment to optimize for various goals: throughput, latency, durability, and availability
- How to Choose the Number of Topics/Partitions in a Kafka Cluster? (2016) and follow-up updates that have happened in Kafka as of version 2.0
- Improving batching with the new sticky partitioner
- KIP-345: Introduce static membership protocol to reduce consumer rebalances
- Benchmark Your Dedicated Apache Kafka Cluster on Confluent Cloud
- Benchmarking Apache Kafka Latency at the 99th Percentile ft. Anna Povzner
Interested in learning more?
If you’d like to know more, you can download the Confluent Platform to get started with a complete event streaming platform built by the original creators of Apache Kafka.
Avez-vous aimé cet article de blog ? Partagez-le !
Abonnez-vous au blog Confluent


