Nouveau dans Confluent Cloud : rendre les données et les pipelines accessibles pour un streaming prêt pour l’IA | En savoir plus
5 Common Pitfalls When Using Apache Kafka
Whether you’re a seasoned Apache Kafka® developer or just getting started you’re likely to hit a snag at some point or another—either in configuring and understanding your clients or setting up and monitoring things on the broker side. With all the moving pieces involved, it can sometimes be difficult to know exactly how to keep your Kafka pipeline running smoothly. To help you combat this, we’ve compiled a list of five common pitfalls and tips for how to avoid them—from client and broker configurations to design and monitoring considerations—that are sure to save you time and effort down the road.
What we’ll cover
From the client side:
1. Setting request.timeout.ms too low
2. Misunderstanding producer retries and retriable exceptions
From the broker side:
3. Leaving key broker metrics unmonitored
4. Going overboard with partitions
5. Setting segment.ms too low
Let’s get started by looking at some of the common configuration mistakes users make on the client side of things.
1. Setting request.timeout.ms too low
request.timeout.ms is a client-side configuration that defines how long the client (both producer and consumer) will wait to receive a response from the broker. The default for this configuration is set to 30 seconds.
If a response is not received before the timeout is reached, then one of two things will happen: either the client will attempt to resend the request (if retries are enabled and have not yet been exhausted, see below for more details on this) or it will simply fail.
It might be tempting to set the request.timeout.ms to a lower value. After all, with a shorter timeout period, clients can react more quickly, whether that means reconnecting or even failing. However, whilst this might sound intuitive, it’s not always a good thing. If you’re not careful, you might exacerbate any problems on the broker side and result in worse performance for your application.
For example, if a broker is taking a long time to handle and process its incoming requests, a lower request.timeout.ms across client applications could lead to increased request pressure as the additional retry attempts are added to the broker’s request queue. This then exacerbates the ongoing performance impact on the brokers, adding to the pressure on it.
It’s recommended to leave request.timeout.ms at the default value of 30 seconds. As discussed above, a lower value could actually increase the amount of time it takes for server-side requests to be processed. Depending on your application needs and if you’re seeing these timeouts often, it may actually be useful to set request.timeout.ms to a higher value.
2. Misunderstanding producer retries and retriable exceptions
When executing producer.send(), the hope is that records go through and are successfully stored in a topic. The reality is that, for some reason or another, the producer request might fail. In certain cases, the failure is transient and retriable (i.e., the failure could be recovered from given a sufficient amount of time and the client retry of the request) whilst others will be permanent (i.e., something needs to be fixed before the request can succeed).
For example, during cluster rolling, some of the following retriable exceptions may be encountered by clients:
- UNKNOWN_TOPIC_OR_PARTITION
- LEADER_NOT_AVAILABLE
- NOT_LEADER_FOR_PARTITION
- NOT_ENOUGH_REPLICAS
- NOT_ENOUGH_REPLICAS_AFTER_APPEND
If retries and retry time are not configured properly, all of these exceptions will be logged as errors, which can potentially disrupt your client and result in lost messages.
A number of producer configurations can have an effect on whether retries are enabled and how they’re handled. Here are the producer configurations to check to ensure that retries are enabled and working as expected:
- retries: As implied by the name, this is the number of retries to attempt. The default value for producer retries is INT_MAX—the largest integer value according to your coding language of choice—but you can set it to any value between 0 and INT_MAX. Keep in mind that whilst this is a large value it doesn’t mean that the client will actually retry forever—in actuality, the request will be retried as many times as possible within the bounds of delivery.timeout.ms.
- delivery.timeout.ms and linger.ms: Producers have the ability to batch records behind the scenes and be more efficient in the way that they send messages to the same partition. linger.ms controls the amount of time that the producer will linger while batching these messages. delivery.timeout.ms is an upper bound on the total time a producer will attempt to deliver a record (with a default of 2 minutes). It must be equal to or greater than the sum of linger.ms and request.timeout.ms.
- retry.backoff.ms: If a retry is attempted, this is the amount of time that the producer will wait before resending the request. Bear in mind that if you set this value too low it’s possible that the event that has caused the transient exception has not yet been resolved, meaning that failures could continue to occur.
- request.timeout.ms: As explained above, it’s recommended to leave request.timeout.ms at the default value of 30 seconds.
- max.in.flight.requests.per.connection and enable.idempotence: max.in.flight.requests.per.connection defines the total number of unacknowledged requests that a given client can have in transit while also maintaining ordering guarantees. When enable.idempotence is set to true, only one copy of a given message will be written to the topic; if false, duplicate messages are possible.
Why are these important? Bottom line: they can impact the ordering of messages on the topic, specifically when retries are enabled, max.in.flight.requests.per.connection is greater than 1, and enable.idempotence=false. Suppose a producer has sent two requests containing messages for the same partition to the broker. The first batch fails and the producer attempts to resend it while the second batch succeeds. That means that the second set of messages will appear on the partition before the messages in the first batch. If ordering is important to your use case and you want to make use of retries, avoid setting both max.in.flight.requests.per.connection greater than 1 and enable.idempotence=false.
- acks: If you want to disable retries entirely you can set this value to 0. This tells the producer to “fire and forget” the request whether there are any exceptions or not. (To learn more about delivery guarantees see this blog post on the top five things every Kafka developer should know.) On the other hand, if you want to enable retries make sure acks isn’t set to 0.
Decide how you’d like your code to behave before you start playing around with the above producer configuration parameters. Do you want retries enabled at all? Check that the retries value is greater than 1 and acks is set to either 1 or all. Would you instead prefer that your producer fail fast and throw exceptions for all potential issues it encounters? Disable retries by setting retries=0. (Note that in this scenario, you still have the ability to handle exceptions on your own within the client code.)
Issues can easily arise when clients are interacting with the cluster, but what about the cluster, itself? It’s just as important to be aware of things that can go wrong with the brokers and how to mitigate them.
3. Leaving key broker metrics unmonitored
Kafka brokers expose a number of really useful JMX metrics that give you great insight into the overall health of your cluster. Unfortunately, not all cluster admins pay enough attention to them.
Some of these metrics are obvious and easy to understand and make use of while others may be a bit hairier to act on, so it’s important to look into and understand the metrics that are available to you. If you’re looking to focus on a handful of key metrics, the following five are a good place to start:
- kafka.server:type=ReplicaManager,name=UnderReplicatedPartitions: Every partition has a number of replicas across brokers in the cluster. Data is first written to a leader replica and then replicated across to the follower replicas. This metric is a count of the partitions which have not yet been fully replicated across the cluster. Any number of under-replicated partitions is a sign of an unhealthy cluster, as it implies that your data is not fully replicated as expected.
- kafka.network:type=SocketServer,name=NetworkProcessorAvgIdlePercent: This metric describes the percentage of time that your network processing threads are idle. All Kafka requests are routed through the network threads, so this metric is pretty crucial. 0 means that all resources are unavailable, and 1 means all resources are available. As a rule of thumb, this value should be above 30% so as to not continuously exhaust your cluster resources.
- kafka.server:type=KafkaRequestHandlerPool,name=RequestHandlerAvgIdlePercent: The request handler takes requests off of a request queue, processes them, and outputs the responses to response queues. Similar to the above, this metric describes the percentage of time that your broker request handler threads are idle. 0 means that the request handler threads are completely unavailable, and 1 means they are all available. Try to keep this value above 30% as well.
- kafka.network:type=RequestChannel,name=RequestQueueSize: This describes the total number of requests in the request queue. A higher count means that the queue is congested, so it’s better to have a lower value for this metric. In conjunction with NetworkProcessorAvgIdlePercent and RequestHandlerAvgIdlePercent you can use this metric to get a good idea of how busy the full Kafka request pipeline is.
- kafka.network:type=RequestMetrics,name=TotalTimeMs,request={Produce|FetchConsumer|FetchFollower}: This is a series of metrics that describes the total time it takes for a given type of request (including the time it takes to send). It exists for each request type—producer, fetchConsumer, and fetchFollower. This metric gives you a good idea of overall latency in your system. A lower time implies a healthier cluster.
Broker request latency, or how quickly requests are being handled by the broker, is extremely important to overall cluster health. What’s more, there really isn’t any other proxy for request health other than enabling request logging (which is very verbose and may drastically impact performance), so metrics really are the way to go. The bottom line is that ignoring these metrics can have ramifications. Among others, slow response times come to mind.
If you didn’t know about JMX metrics or weren’t paying too much attention to them, you should begin to do so. Knowing they exist is half the battle, and now you can start to act on the metrics and make your cluster healthier and more resilient. The above example metrics are just the tip of the iceberg, and we encourage you to take a look at these additional resources:
- Exhaustive list of broker metrics
- JMX monitoring stacks for Confluent Platform
- Monitoring Your Event Streams: Integrating Confluent with Prometheus and Grafana
- Observability Overview and Setup for Confluent Cloud
After reading all of this, you may think to yourself: What good are broker metrics if I can’t see when a rogue client is abusing the cluster? That’s certainly important! We see your concern and raise you KIP 714 (at the time of this writing, it is under discussion). This KIP offers higher client observability from within the broker. How cool is that?
If the thought of monitoring all of these metrics is daunting, you should know that Confluent Cloud, our fully managed Kafka service, handles all of this for you. Latency, utilization, and a simplified cluster load metric are exposed by default for dedicated clusters.
4. Going overboard with partitions
Partitions are Kafka’s unit of parallelism—barring other factors such as consumer throughput, of course—so in order to increase your overall throughput, it would make sense to use as many partitions as possible, right? Well, not necessarily. A higher partition count may have a number of consequences in the cluster including but not limited to:
- Increased number of file handlers, which could surpass the limit set by the underlying operating system. When a message is produced to a topic, that message is bucketed into a specific partition. Under the hood, the data is actually appended to a log segment file (more on this in the next section) and an accompanying index file is updated. A file handler is maintained for both the data file and the index file. Thus, if you have 10 topics each with 50 partitions, there are at least 2,000 file handlers at any given time. To put that into perspective, Linux typically limits the number of file descriptors to 1,024 per process.
- Higher chance of partition unavailability when broker failover occurs. In an ideal, resilient cluster, every partition is replicated a number of times across other brokers in the cluster. One broker is chosen to maintain the leader replica, and all other replicas are followers. In the event that a broker fails, any leader partitions that it owns become unavailable for a certain period of time while the controller (another broker within the cluster) works to elect one of the follower replicas as the new leader.
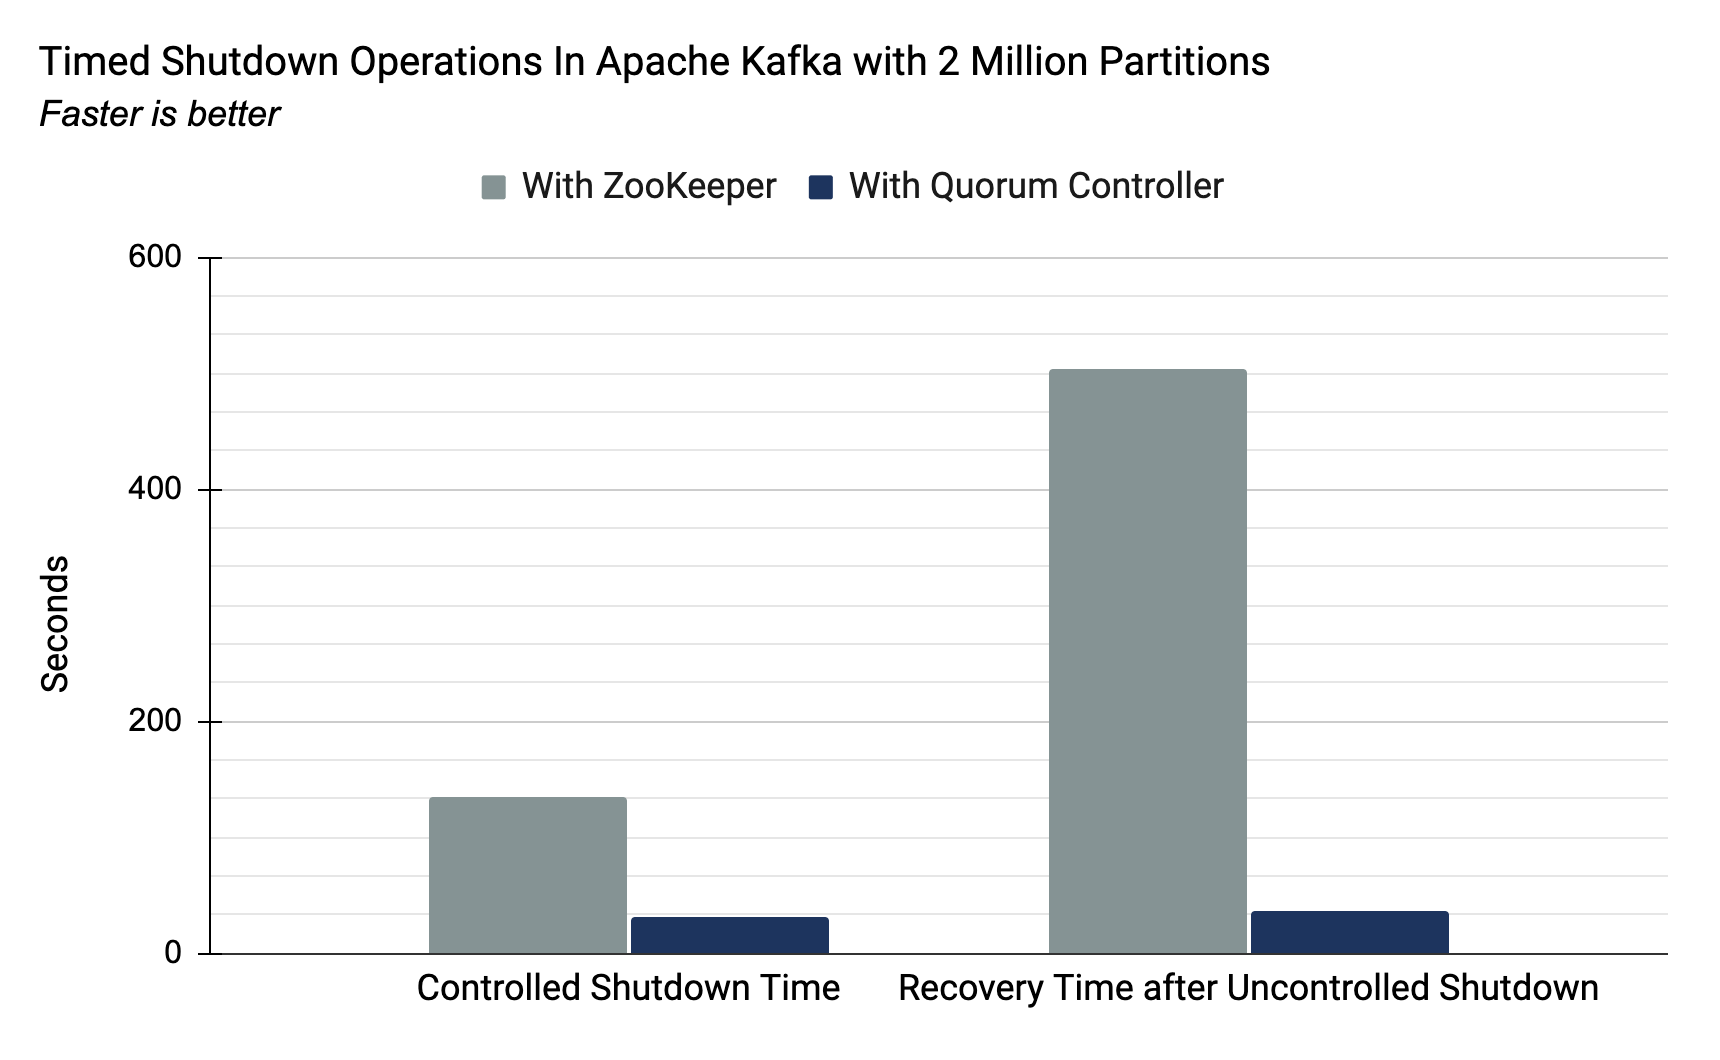
There are three different types of broker failover that can occur: clean, unclean, and one involving a failed controller. Thankfully, in a clean shutdown, the controller can be proactive about electing leader replicas and the downtime is relatively low. That being said, when the shutdown is unclean, the controller cannot be proactive, and all of the leader partitions on the failed broker will be unavailable at once while the controller determines the leader replicas. This becomes even worse in the event that the controller broker goes down; not only does a new controller need to be elected, it also has to initialize itself by reading metadata for every partition within ZooKeeper. In these last two cases, the time these partitions will be unavailable is directly proportional to the number of partitions in the cluster. Higher partition counts means greater downtime.
- Increased end-to-end latency. Consumers are only exposed to messages on the topic once the message has been committed to all in-sync replicas. With more partitions, the bandwidth required to replicate these partitions is increased. The additional latency incurred during this step results in more time between when a producer writes a message and when a consumer can read that message.
Another important point to note is that, if you’re using Kafka with ZooKeeper today, you’ll find the partition limit is around 4,000 per broker and 200,000 per cluster. With the move away from ZooKeeper as part of the KIP-500 implementation, this will change drastically. Since the cluster will no longer use ZooKeeper to store metadata regarding partitions and brokers, there will be greatly increased scalability. To put a number on this, tests showed that with the new metadata quorum controller a cluster could easily contain upwards of 2 million partitions.
So how do you avoid encountering these problems? Design topic partitions with care, and strike the balance between planned throughput and usage, and the downsides of over-provisioning. Whilst it’s possible to change the number of partitions on a topic it’s not always desirable to do so because of the impact it will have on message ordering.
How many partitions to use for a topic?
The formula for determining the number of partitions per Kafka topic has been pretty well explored over time. When creating a new topic in your Kafka cluster, you should first think about your desired throughput (t) in MB/sec. Next, consider the producer throughput that you can achieve on a single partition (p)—this is affected by producer configurations but generally sits at roughly 10s of MB/sec. Finally, you need to determine the consumer throughput (c) you will have—this is application-dependent so you’ll have to measure it yourself. You should anticipate having at least max(t/p, t/c) partitions for that topic. So if you have a throughput requirement of 250 MB/sec, with a producer and consumer throughput of 50 MB/sec and 25 MB/sec respectively. Then you should use at least max(250/50, 250/25) = max(5, 10) = 10 partitions for that topic.
5. Setting segment.ms too low
Whilst partitions are as low-level as the producer API gets, when it comes to storing these actual bytes on disk, Kafka splits each partition into segments. Each segment represents an actual data file on disk. Understanding how segments work and are configured is important to ensure that the broker behaves optimally.
As messages are written to the topic, the data is simply appended to the most recent open log segment file for the partition in which the message belongs. While a segment file remains open, it cannot be considered a candidate for deletion or log compaction. By default, these log segment files will remain open until they’re completely full (1GB) as per the topic-level segment.bytes configuration parameter. Instead, you may wish to force the segment to roll after a specific amount of time; this can be set using segment.ms, another topic-level configuration.
Some users will attempt to set segment.ms to a low value to help trigger log compaction or deletion more frequently, reducing the amount of memory their cluster will take up on disk. However, if segment.ms is configured to be too low (the default is seven days), your cluster will generate a lot of small segment files. With too many of these small segments, your Kafka cluster is liable to encounter a “Too many open files” or “Out of memory” exception. Furthermore, a large number of small or empty segment files can have a negative performance impact on consumers of the topic. During a fetch, consumers can only receive data from at most one segment per partition. So if the segments are very small, the consumers are limited in what they can consume at a given time and, as a result, will have to make more trips to the broker.
Unfortunately, to avoid this common pitfall, you need to be diligent about your configurations when creating and managing topics in your cluster. If a user sets segment.ms to a low value, it’s important to remember to set the value back to the default as soon as possible. After doing so, note that these changes are not retroactive, and previous segments will not be affected.
Conclusion
The five pitfalls covered in this article can be avoided by following these tips:
- Avoid setting request.timeout.ms too low
- Review producer retries and retriable exceptions the next time you write a producer client
- Monitor broker metrics and make sure your cluster is healthy
- Be mindful of your partition counts, especially as you create new topics
- Make sure segment.ms isn’t set too low
You can also easily avoid the broker-related pitfalls by using Confluent Cloud. With this fully managed Kafka service you can concentrate on writing your client applications instead of worrying about keeping the brokers running! Use the code CL60BLOG for an additional $60 of free usage.*
Here are some great resources to learn more about Kafka:
- For hands-on tutorials in a number of languages, check out Kafka Tutorials.
- And don’t forget to read the fine Apache Kafka documentation!
Avez-vous aimé cet article de blog ? Partagez-le !
Abonnez-vous au blog Confluent


