Apache Kafka®️ 비용 절감 방법 및 최적의 비용 설계 안내 웨비나 | 자세히 알아보려면 지금 등록하세요
Visualizations on Apache Kafka Made Easy with KSQL
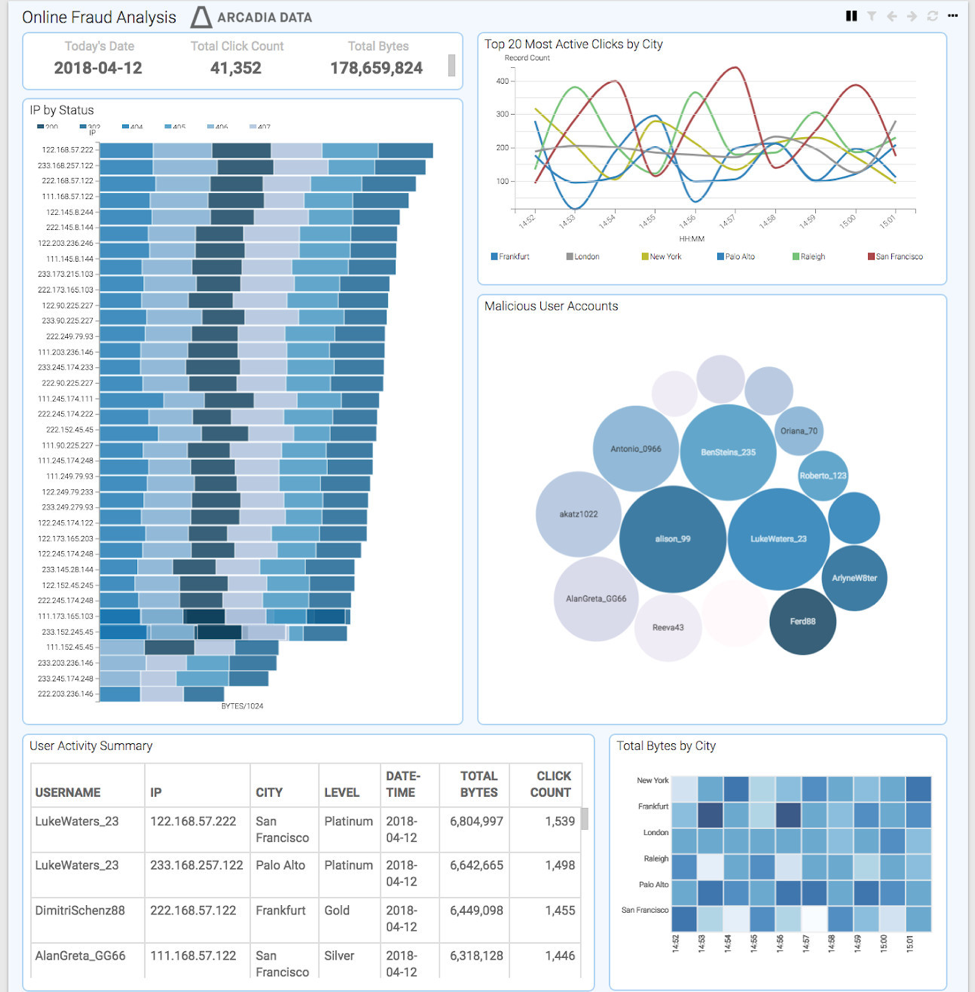
We’re pleased to welcome our partner Arcadia Data to the Confluent blog today. Shant Hovsepian is the CTO and co-founder of Arcadia Data, and is going to tell us about how to get started with processing streaming data with Confluent KSQL and visualizing it using the Arcadia Data platform.
The first Kafka Summit London was just last month, and a popular topic at the show was KSQL. Released for production use with Confluent Platform 4.1, KSQL gives Kafka users a streaming SQL engine so they can use a SQL-like language to process and query data in Kafka. It’s been getting a lot of traction since, and thanks to a lot of hard work and dedication, it was just released in production-ready form as part of Confluent Platform 4.1. This is a huge step in simplifying many types of stream processing that can be run on Kafka. With the wealth of existing expertise of SQL, developers can now use those skills with KSQL to more quickly build applications for data filtering, transformation, enrichment, manipulation, and analysis of Kafka data.
KSQL is a game-changer not only for application developers, but also for non-technical business users. How? The SQL interface opens up access of Kafka data to analytics platforms based on SQL. Business analysts who are accustomed to non-coding, drag-and-drop interfaces can now apply their analytics skills to Kafka. So instead of continually building new analytics outputs due to evolving business requirements, IT teams can hand a comprehensive analytics interface directly to the business analysts. Analysts get a self-service environment where they can independently build dashboards and applications.
Arcadia Data is a Confluent partner that is leading the charge for integrating visual analytics and BI technology directly with KSQL. We’ve been working to combine our existing analytics stack with KSQL to provide a platform that requires no complicated new skills for your analysts to visualize streaming data. Just as they will create semantic layers, build dashboards, and deploy analytical applications on batch data, they can now do the same on streaming data. Real-time analytics and visualizations for business users has largely been a misnomer until now. For example, some architectures enabled visualizations for end users by staging Kafka data into a separate data store, which added latency. KSQL removes that latency to let business users see the most recent data directly in Kafka and react immediately.
We’re hearing a lot of excitement about important business uses. For example, customers are looking to optimize operations by immediately analyzing the effects of their latest applications. With the feedback loop enabled by KSQL, they are able to adjust and optimize more quickly. Others are looking to detect operations errors such as discrepancies in transaction information in real time versus end-of-day problem resolution. In some cases, the goal isn’t necessarily real-time access, but simply reducing time-to-analysis from hours to minutes.
If you want to experience this for yourself, getting started is easy. You can download binaries that get you exploring visualizations on Kafka very quickly. The binaries consist of the free desktop analytics tool, Arcadia Instant, plus Docker images that have containerized versions of Kafka and KSQL. This means you can set up a test environment in minutes that runs entirely on your desktop. You don’t have to worry about setting up a cluster of nodes or about setting up cloud instances—you can just start experimenting. As long as you have about 8 GB RAM on your system, then you have plenty of power to run this setup. There are also a few walkthroughs that will guide you through the process of setting up a visualization environment.
Getting Started with Arcadia Instant in Combination with Confluent Platform
To get started, please follow our Get Running with KSQL guide. It will tell you how to create a working setup of Arcadia Instant and the Confluent Platform components KSQL and Kafka (plus sample data).
From there, build an example dashboard by following our guide, A Day in the Life of a Business Analyst Using Streaming Analytics. You can also watch the video version of the guide. Even if you have no prior experience with Arcadia Data, you will find the guide to help you quickly get up to speed on building a real dashboard. More information is available on our streaming visualizations web page.
In summary, if you’re an application developer who works with Kafka, or hopes to work with it soon, KSQL is the right technology choice for many types of processing you’ll need to do. And if you want to expose your analytics capabilities to a non-technical audience, you no longer have to build your own visualization outputs in something like Excel, or spend a lot of time bolting on a tool designed for other environments. The best choice is to go with a proven technology like Arcadia Data running with KSQL to provide that “last mile” of streaming data capabilities to your end users. So take a look at what Confluent and Arcadia Data have done, and stay tuned for more innovations in the coming months!
If you’re interested in what KSQL can do:
- Watch the introductory video at the KSQL home page
- Download the Confluent Platform and follow the quick start to get started with KSQL
- Questions? Ask them in the #ksql channel on our community Slack group
이 블로그 게시물이 마음에 드셨나요? 지금 공유해 주세요.
Confluent 블로그 구독


Customer Intelligence Hub: A Single Pane of Glass for Customer Insight and Action
Customer Intelligence Hub unifies customer signals into a real-time, AI-powered view that helps GTM teams prioritize risk, identify opportunity, and act faster with contextual insights.