Apache Kafka®️ 비용 절감 방법 및 최적의 비용 설계 안내 웨비나 | 자세히 알아보려면 지금 등록하세요
Comprehensive Streaming Analytics Platform for Visualizing Real-time Data
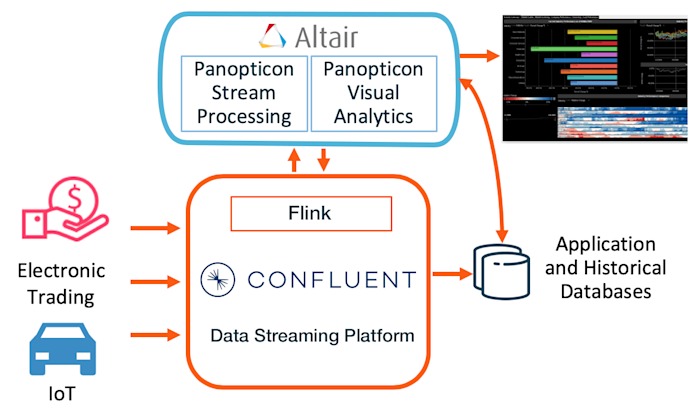
Customers today are dealing with huge amounts of fast changing data requiring immediate, real-time decisions, particularly in financial markets and Internet of Things (IoT) applications. With Panopticon and Confluent Platform, business users are enabled to build sophisticated stream processing data flows using a standard web browser, start their analytical models, and begin visualizing output in minutes. With Panopticon, users don’t need to know how to write any Java or Scala scripts to make full use of Confluent Platform’s wide range of event streaming capabilities. Panopticon supports a comprehensive set of real-time and time series data visualization and data handling capabilities and works directly with Kafka and Confluent Platform for a complete solution.

Why Altair Panopticon and Confluent Platform?
Real-time Views
Fast insight to improve performance
Detect Anomalies
Program alerts to help identify fraud
React Immediately
Turn raw events to actions – optimize performance or change behaviors
No Coding
Reduce development time for new analytics dashboards to minutes
Panopticon Integration with Confluent Platform
Confluent provides a robust and performant platform for Panopticon’s analytics processing, required by markets such as financial and IoT. Kafka Streams enables partitioning, load-balancing, fail-over and security while schema registry and Avro form the foundation for data manipulation that is essential for modeling. Together, customers enjoy a faster time-to-market and easier user adoption.
