Apache Kafka®️ 비용 절감 방법 및 최적의 비용 설계 안내 웨비나 | 자세히 알아보려면 지금 등록하세요
Real-Time Presence Detection at Scale with Apache Kafka on AWS
Zenreach provides a platform that leverages Wi-Fi and enables merchants to better understand and engage with their customers. Most of our product features depend on one basic building block: real-time customer presence detection.
In this blog post, we share our journey of implementing a real-time presence detection platform and how we leveraged Kafka Streams. Being a startup, our platform started off as a set of Python scripts, moved to Spark Streaming and ultimately ended up being re-implemented using Kafka Streams in early 2017 for ease of operations and cost reasons.
Since switching to Kafka Streams (we started with version 0.10.2.1 and are currently on 0.11.0.1), we have learned a lot about the Apache Kafka® ecosystem. We have implemented logging, monitoring and state management, and have gained significant understanding of which parameters need to be tuned. We have rolled out a robust platform that is highly available and fault tolerant and offers a degree of observability that we never had before. This, along with the fact that all of our streaming services are now running in containers on Amazon Elastic Container Service (AWS ECS), has helped us save thousands of dollars per month. Finally, we have noticed a significant increase in developer productivity.
Our use case
As we receive Wi-Fi device data from our routers, we need to perform presence detection. When we talk about presence detection, we are primarily interested in detecting walk-ins. A walk-in indicates that a customer is actually at the store.
Once we have detected presence, we know that a specific device was sighted at the business. However, oftentimes this is not enough. We need to enrich this walk-in with customer contact information (e.g., email) to make it useful. Contact information is emitted to Kafka by our customer relationship management (CRM) service each time a customer logs in with our Wi-Fi portal.
Finally, we need to maintain a walk-in count for each business and contact, keeping it updated as customers visit our businesses.
Why Kafka Streams
In our early days, we quickly implemented the aforementioned use case with a number of Python scripts running on a single machine. However, as the company quickly scaled by adding more businesses, the Python scripts were no longer sufficient to support the increasing probe throughput. As a result, we re-implemented our system using a monolithic Spark Streaming application. This Spark Streaming application was detecting walk-ins, enriching walk-ins with contact information, maintaining walk-in counts, storing walk-in counts in our database and emitting presence events (e.g., walk-ins and enriched walk-ins) to Kafka. Over time, it became obvious that this approach of a gigantic Spark Streaming application had some serious drawbacks:
- It was very hard to fix and deploy bug fixes in various parts of this application. For example, a bug in the walk-in algorithm required a redeployment of the entire application even though other parts of the application were working fine.
- It was very hard to monitor this application, as we had no proper centralized resource monitoring and logging (stdout/stderr) on our Amazon Elastic MapReduce (AWS EMR) infrastructure.
- We were running blind in regards to resource consumption (e.g., CPU, memory).
- Developers had a hard time finding error logs. Indeed, they had to browse various Hadoop UIs to get to Spark executor logs. This was time and resource intensive.
- We had no central scheduler to run the Spark application. Consequently, our application was started as a cron job on a dedicated Amazon EC2 machine and restarted by the same cron job if it failed. Finding out why the application crashed was cumbersome.
- The EMR infrastructure was not plugged into our CI/CD system; hence, rolling out new features and bug fixes to production was manual and error prone.
- The cost of running entire EMR infrastructure for just one use case was huge. A single EMR cluster was costing us thousands of dollars a month.
It was pretty clear that we could no longer continue operating with these drawbacks, so we decided to take the following actions:
- Split the monolithic Spark application into multiple applications, according to their logical responsibility, to make bug fixing easier
- Plug the applications into our centralized Prometheus-based monitoring and alerting system to gain resource usage observability
- Integrate all applications with Rollbar and Logentries, the two logging solutions that we use for our core services
- Integrate all applications into our CI/CD system in order to release them along with our core services
- Significantly cut down on our EMR costs by running all applications in containers along our core services
Given these changes and the fact that we already had Kafka running on our infrastructure, we looked for a streaming solution that would integrate smoothly. We wanted to do streaming without additional infrastructure, allowing us to run the streaming services with our core services. We had learned it the hard way that maintaining additional infrastructure (e.g., EMR) with a limited amount of engineering resources is nearly impossible, especially for a company of our size (100-200 people). We liked the idea that Kafka Streams is a client library built on top of existing Kafka features (e.g., consumer groups). Despite being relatively new at the time, Kafka Streams provided the features we needed (e.g., state stores, joins, windowing and punctuation).
Our system
Our system architecture is shown below: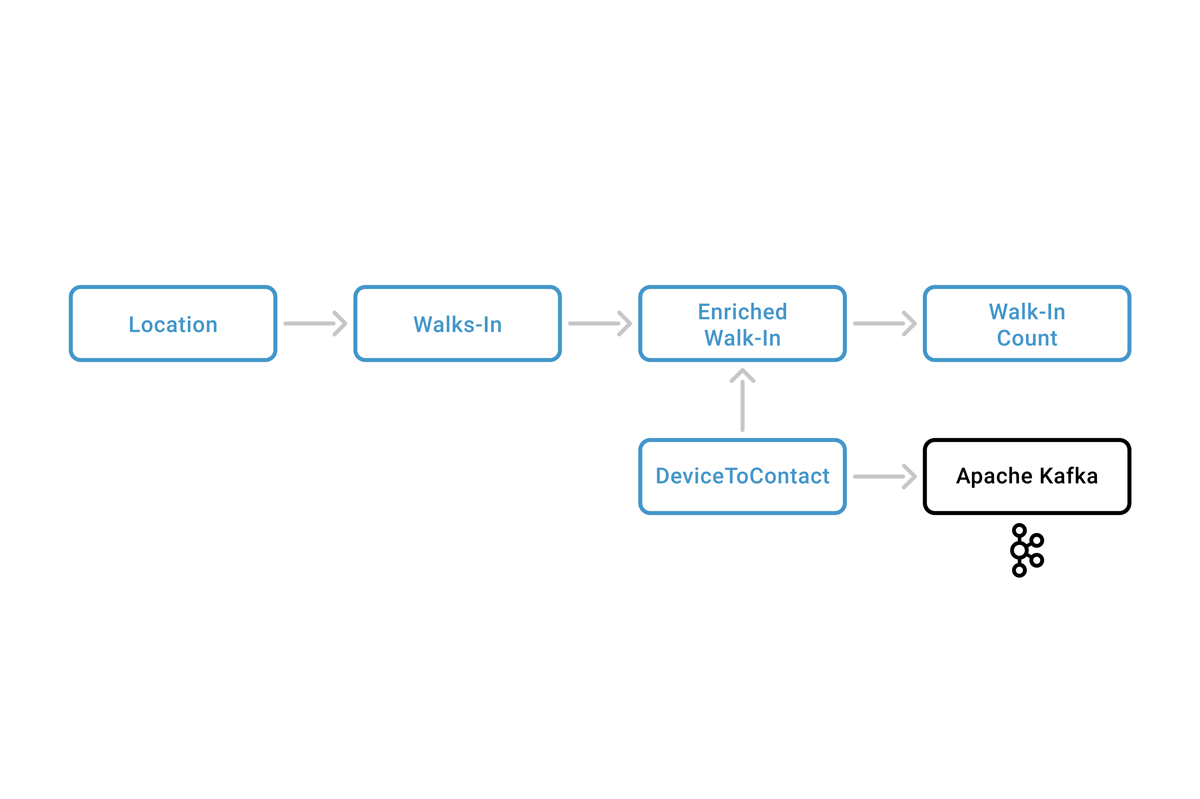 As customers visit businesses, routers collect device (e.g., phone) probe requests and send them to our location service. Each probe request includes a unique device identifier used to detect presence. Our presence platform is made up of four services: Walk-In, DeviceToContact, Enriched Walk-In and Walk-In Count.
The Walk-In service detects devices and emits walk-in events to Kafka.
The DeviceToContact service reads CRM events, such as a portal login, and turns them into device-to-contact mappings. A device-to-contact mapping identifies the businesses at which the device was seen and the contact information that was used by the device-to-portal login. Device-to-contact mapping events are emitted to Kafka.
The Enriched Walk-In service takes the walk-ins and enriches them with contact information by joining them with the device-to-contact mapping events. The enriched walk-ins are emitted back to Kafka.
The Walk-In Count service maintains a walk-in counter for each business-contact pair. It reads enriched walk-ins and updates the internal walk-in counter for each business-contact pair. For each update, it emits walk-in count events to Kafka with the most recent counts.
We have downstream systems that consume walk-ins, enriched walk-ins and walk-in count topics for various product features. Examples include sending marketing emails to returning customers or showing customers that are currently in the store on our mobile application.
Lessons learned
Scaling your services
One important consideration that led us to choose Kafka Streams was ease of scaling. Kafka Streams-based services can scale horizontally merely by increasing the number of service instances. In this context, it is important to understand the Kafka Streams threading model which is made up of two concepts: stream threads and stream tasks. Stream threads are real Java threads. They can be seen as pools of available resources for data processing. Stream tasks are abstract units of computation that are managed by stream threads. Each stream task processes a maximum of one partition per topic. A stream thread can process multiple stream tasks.
Internally, a stream thread initializes a Kafka consumer that fetches records for multiple topic partitions. Records of multiple stream tasks/partitions are processed by a stream thread sequentially by passing them through the defined topology. It is important to make sure that stream tasks are well balanced across the stream thread. Otherwise, throughput will be negatively impacted. A single stream task that is stuck in a blocking call to an external service can also stall the entire stream thread, and long blocking calls should be avoided.
Kafka Streams provides the parameter num.stream.threads that can be used to control the number of stream threads per service instance. We had to adjust this parameter to make sure that we achieve best processing throughput on our services. For example, if a service is deployed with four instances and num.stream.threads per instance is set to four, in total 16 stream threads are available for stream processing. If a topic has 32 partitions, Kafka Streams will create 32 stream tasks for 32 partitions, and assign two stream tasks per stream thread.
Persistent storage
Most of our streaming services are stateful. For example, they need to keep track of walk-ins and walk-in counts. Kafka Streams uses changelog topics and RocksDB-backed state stores to enable stateful services. When we first started with our platform, we deployed streaming services on ECS the same way we deployed stateless services. This caused a major issue during releases.
For a release, we typically do a blue-green deploy of our services to minimize downtime. Therefore, services get restarted and can be scheduled on any machine in our ECS cluster that has sufficient resources in terms of CPU and memory. This results in a RocksDB state loss, as the newly selected machine no longer has the previous state store content. In this case, Kafka Streams starts to recreate the state store content from the backing changelog topic. With the amount of state that our streaming services are managing, it took hours for the streaming services to become stable after the release was complete.
To resolve this issue, we attached EBS GP2 volumes to a subset of our ECS machines and used ECS placement constraints to pin our stateful streaming services to the machines. We then used Docker volumes and the Kafka Streams state.dir configuration parameter to ensure that our Kafka Streams services make use of the persistent storage. This has enabled us to make releases of Kafka Streams services instant with no downtime.
Fault tolerance
In the event of a service instance start, stream tasks need to be assigned. Stream tasks are sticky to their state. On startup, Kafka Streams checks the local state directly state.dir and if it finds the existing state, it tries to reuse it. Specifically, it assigns stream tasks to instances that have state available. This turned out to be extremely useful for us as we use EBS volumes for persistent storage. If stream tasks were not sticky, they would need to replay state from the corresponding changelog topics, thus defeating the purpose of persistent storage.
In the event of a service instance crash, stream tasks need to be reassigned to different service instances. This causes a temporary drop in throughput as the resulting consumer group rebalancing may take some time. Indeed, if state stores are involved, state needs to be replayed from the changelog topics. In order to reduce the recovery time in the event of a service instance crash, Kafka Streams provides the parameter num.standby.replicas, which defaults to zero. This parameter controls the number of standby stream tasks that are available to take over if primary task failure occurs.
Standby stream tasks do not actively process records. Instead, they just keep replicating the state of primary stream tasks. Kafka Streams will make sure that standby stream tasks are placed on distinct service instances from where the primary stream tasks are hosted. We have adjusted this parameter to one in production. As a result of this, each stream task has a standby stream task available to take over in the event of a service instance crash. This has helped us to greatly reduce rebalancing duration and downtime during outages.
As another consideration, it may be desirable to further place stream tasks across multiple availability zones (AZs). AZs are typically located in different physical locations. This would further improve fault tolerance in cases where one AZ goes down, as no two replica stream tasks would be residing on the same AZ. As of today, Kafka Streams does not provide such a feature. However, it is planned and currently in development (see KAFKA-6718).
Rebalancing
Rebalancing happens when Kafka assigns partitions to consumers. This is a normal process as part of Kafka consumer group protocol and should ideally happen as rarely as possible, such as during a service restart or service instance failure. When rebalancing happens too frequently, it can result in some serious throughput degradation. Rebalancing can happen for many reasons and unfortunately we have encountered quite a few.
Failure to send heartbeats to coordinator on time
If your service does not manage to send heartbeats on time to the current group coordinator—one of the Kafka brokers—Kafka would consider the consumer as dead and trigger a rebalancing process. Fortunately, Kafka Streams and more specifically the Kafka consumer has two parameters to control the heartbeat interval: heartbeat.interval.ms and session.timeout.ms. The first parameter controls how often heartbeats should be sent to the coordinator. The second parameter controls how long the coordinator should wait until a consumer is considered dead, in which no heartbeat is received. In order to increase session.timeout.ms on the clients, we ended up increasing the group.max.sesion.timeout.ms parameter on our Kafka brokers. This parameter with a default of 30 seconds controls the maximum session timeout that can be used by the clients.
Long garbage collection pauses
Many of our services are memory intensive with extensive usage of state stores and in-memory caches. If your service takes more than 10 seconds in garbage collection (GC) pauses, it can trigger the consumer to be kicked out of the consumer group and thus force a rebalancing process among the remaining consumers. We have reacted to such situations by giving more memory to our streaming jobs and adjusting the heap sizes. We have also made sure that we close all state store iterators. Otherwise, the memory consumption would keep increasing. Our services are using Java 8. We have switched to the Garbage-First (G1) GC to further reduce lengthy pause times. Finally, to help dealing with longer GC pauses, we have decreased the heartbeat interval and increased the session timeout.
Long blocking calls inside the Kafka Streams API
Some of our downstream services are reading data from Kafka like walk-in counts and writing data back to a database to be shown by the UI. In the early days, we simply wrote such data synchronously into the database while reading Kafka, such as inside a foreach call. As it turns out, each stream processor thread in Kafka Streams calls poll() on Kafka to fetch records of potentially multiple partitions. Internally, the stream processor thread logic is sequential. In other words, a stream processor thread processes records of potentially many partitions one at a time. Depending on the amount of data to be processed and latency in writing to the database, it can take a while to write out all of the data to the database.
We had run into several issues where processing all the records took too long and consumers were kicked out of the consumer group, which triggered rebalancing. We found that a Kafka consumer has a parameter called max.poll.interval.ms that can be used to control the maximum delay between consecutive poll() invocations. We also learned that the parameter max.poll.records is extremely useful as it allow us to control how many records will be fetched from Kafka in each poll() request. To control the amount of time that clients will wait for Kafka to respond with data, we used the request.timeout.ms parameter.
As our Kafka cluster became more loaded, some fetch requests were timing out. By tuning these parameters and making all our database calls asynchronous, we were able to greatly improve the service stability. Note that max.poll.interval.ms is set to MAX_VALUE by default. In the beginning, we made the mistake of changing this default to a lower value which caused more harm than good. We advise to keep it as is.
Initial consumer group rebalancing
As we were deploying and releasing our services in containers, we noticed that a lot of rebalancing was happening during the release periods. This was due to the fact that in a container environment, service instances typically come online in a non-deterministic order. Moreover, the time between the service instances becoming available depends on the resource availability in our ECS cluster. Each time a service becomes available, it triggers a consumer group rebalancing in order to get partitions assigned.
Our services are deployed with many instances for performance and fault tolerance reasons. We noticed that a significant amount of rebalancing had to happen in order for the service as a whole to become stable. Fortunately, Kafka broker offers the configuration parameter group.initial.rebalance.delay.ms to control the rebalancing delay. This allowed us to delay the initial rebalancing until the majority of our service instances became available. We increased the default value of three seconds for this parameter to 60 seconds on all our Kafka brokers, which has helped to significantly reduce the number of rebalance rounds.
Logging, monitoring and alerting
One of the big reasons why we moved to Kafka Streams is ease of logging with stdout and stderr. Kafka Streams services are treated the same way as our core services, so we can leverage the same logging infrastructure. We initially started out by routing all logs to Amazon CloudWatch. However, this turned out to be cumbersome for developers as CloudWatch offers limited search capabilities. Furthermore, we wanted to route all logs with a logging level greater than WARN to Slack so that we could react to them quickly. Over time, we added support to write all logs to a cloud service called Logentries. This allowed us to easily search and analyze logs. For routing critical exceptions to Slack, we used another service called Rollbar.
In addition, monitoring is a critical piece of running a production infrastructure. We need to know the following and more:
- How much memory our services are consuming
- How much time services spent in GC
- Current throughput on all services
- How far the services are lagging behind
- How much storage headroom we have left on our EBS volumes
- How much storage is left on the Kafka brokers
- RocksDB performance
We use Prometheus across the board to collect, visualize and alert on critical metrics from all our services. We have also instrumented our services to report custom metrics. For example, we have used the KafkaStreams#setStateListener API to get notified about state transitions (e.g., REBALANCING to RUNNING, and vice versa).
To gain insights into various JVM-related metrics like GC time, memory consumption, RocksDB performance and throughput per Kafka topic, we found the Prometheus JMX exporter to be very useful. We run it alongside all our streaming services and Kafka itself. For reporting lag on various Kafka topics we have deployed the Prometheus Kafka Consumer Group Exporter. To know how much disk storage is left on our machines, we use the Prometheus Node Exporter, which is deployed on all our ECS instances. For container-level CPU, memory and network utilization metrics, we run cAdvisor. All of this combined provides us significant insights into the current operations of our presence detection platform.
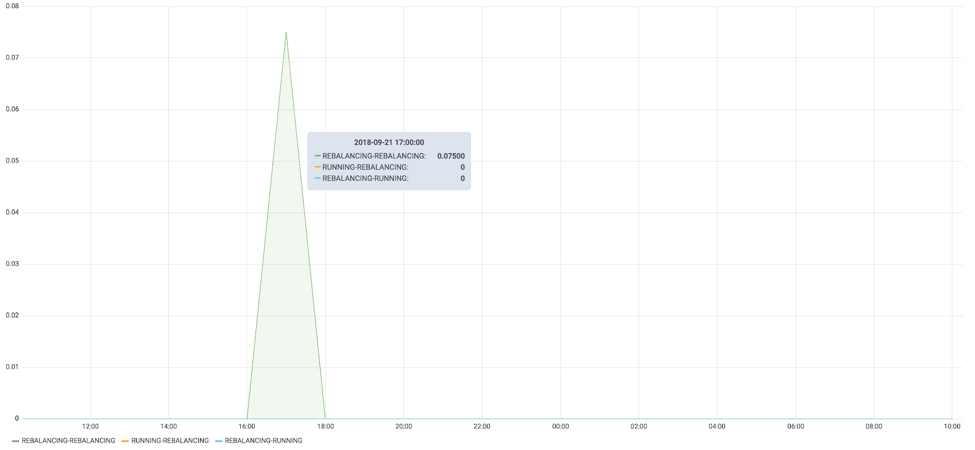
Figure 1. Rebalancing rate graph for one of the services
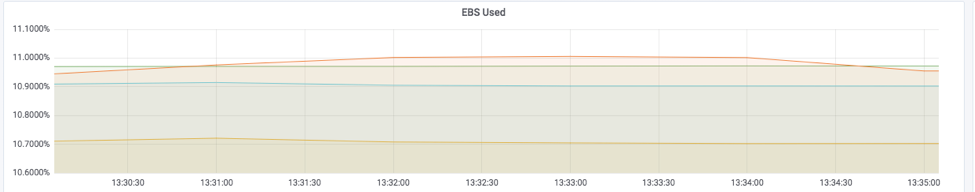
Figure 2. EBS disk usage percentage graph for one of the services
Data backfilling
One of the important requirements in our streaming pipeline is data backfilling. We present two examples where data backfills are important in our pipeline: (1) walk-in count and (2) device to contact.
Walk-in count example
When a topic is deleted or corrupted, it is required to provide a base walk-in count to the walk-in count service. Base walk-in counts are the state from which we start incrementing walk-in counts. Walk-in counts are stored in a state store. Initially, we used a Cassandra table which was backfilled from our Amazon S3 archives with the latest walk-in counts when needed. The walk-in count service consulted this table in the event that a walk-in count is unknown. However, this required an ETL job that reads the walk-in counts from our primary database MongoDB and dumps them to Cassandra. This did not scale well with the amount of walk-in counts that we had and resulted in all sorts of issues while writing to Cassandra to the point where Cassandra would go down during ETL.
After learning the Kafka internals, we decided to take another approach. It was possible to backfill data into the changelog topic that backs the walk-in counts state store directly. Kafka Streams would automatically bootstrap the state store to the end of the topic. This turned out to be very useful for us. We wrote another ETL job that simply reads walk-in count backups from our S3 archives and backfills them directly to the changelog topic.
DeviceToContact Example
Our DeviceToContact service maintains a mapping from device identifier to contacts. This mapping is important as it is used by the Walk-In service to enrich walk-ins with contact information. Internally, the DeviceToContact service reads CRM event streams as KTables and performs a join. The resulting device-to-contact mappings are stored in a log-compacted topic.
Similarly to the previous example, a backfill may be required in case the device-to-contact mappings were computed wrongly and/or data was lost. This can be achieved by an ETL job that regenerates CRM events from our database and writes the data back to dedicated backfill topics. The backfill topics can be consumed by our service in addition to regular topics. KTables unlike KStreams do not support consuming from multiple topics, as they would not be able to guarantee record order per key. We ended up creating KStreams out of our input topics and the corresponding backfill topics that were turned into KTables (see here for more details).
Data corruption
Each record in a Kafka topic has a cyclic redundancy check (CRC) checksum associated with it. Data corruption may occur if the records content was modified such that the stored CRC checksum no longer matches the recomputed one. This results in a client-side CorruptRecordException thrown in the Kafka consumer fetch layer as it attempts to validate consumed records (see KAFKA-6977). We have run into CRC checksum failures primary with log-compacted topics, leading services to crash and be unable to process records. A Kafka consumer does not have a way to skip corrupted records (see KAFKA-7405).
Using the KafkaStreams#setUncaughtExceptionHandler API was not an option for us, as the exception handler is called after the stream thread has already died. Similarly, using the default.deserialization.exception.handler setting (see KIP-161) is not an option, as it is called after data has been fetched. Hence, it is not adequate to handle CRC checksum failures that happen in the data fetch layer.
Although we were unable to reproduce the CRC checksum failures, we suspect they might be related to a bug in the log compaction mechanism and/or use of SSD disks on our Kafka brokers using version 0.10.2.1 at the time. Fortunately, we found that Kafka provides great consumer group tooling that enables resetting consumer group offsets and/or skipping bad offsets. Specifically, the bin/kafka-consumer-groups CLI can be used to manipulate consumer group offsets.
Resetting consumer group offsets on all partitions to earliest and/or latest was not an option for us, as it would result in data loss. However, the same tool allowed us to shift offsets by a delta and/or time. We used shift offsets to skip corrupted records and ended up deploying a new Kafka 1.1.0 cluster. So far, we have not run into further CRC checksum failures. It would be great if a Kafka consumer could be extended with the ability to gracefully intercept and ignore corrupted records.
Conclusion
Our presence platform has evolved from a set of Python scripts to a robust streaming pipeline based on Kafka Streams. While it was a bumpy ride in the beginning, looking back at our evolution, Kafka Streams turned out to be a great choice for our use case. It has allowed us to simplify our streaming infrastructure greatly. Our streaming services can now be deployed in the same manner as our core services in containers on AWS ECS. This is a huge win, as a separate data infrastructure is no longer required. Indeed, this has allowed us to decommission our entire EMR deployment, which was costing us thousands of dollars per month.
Deploying on ECS also greatly simplified our streaming services release process, improved developer productivity and streamlined monitoring and alerting. Our presence platform services are now released in the same manner as core services, debugged in the same manner as core services and monitored the same way as our core services via a global Prometheus monitoring and alerting system. We are very much looking forward to reworking other parts of our product to be event driven using Kafka technology as we move to the latest Kafka Streams version.
About Apache Kafka’s Streams API
If you have enjoyed this article, you might want to continue with the following resources to learn more about Apache Kafka’s Streams API:
- Get started with the Kafka Streams API to build your own real-time applications and microservices
- Walk through the Confluent tutorial for Kafka Streams API with Docker and play with Confluent demo applications
We would not have been able to get where we are today without the wonderful Kafka community. I would especially like to thank Matthias J. Sax from Confluent for his amazing help in answering and clarifying many of our internal Kafka Streams questions.
 |
Eugen Feller is a staff software engineer and technical lead at Zenreach, where he is responsible for the data infrastructure. He holds a Ph.D. with honors in computer science from the French Institute for Research in Computer Science and Automation (INRIA). |


