Apache Kafka®️ 비용 절감 방법 및 최적의 비용 설계 안내 웨비나 | 자세히 알아보려면 지금 등록하세요
Bringing Your Own Monitoring (BYOM) with Confluent Cloud
As data flows in and out of your Confluent Cloud clusters, it’s imperative to monitor their behavior. Bring Your Own Monitoring (BYOM) means you can configure an application performance monitoring (APM) product with a Confluent Cloud cluster in order to monitor the telemetry flowing through the cluster. Popular APM products include Prometheus, Grafana, Splunk, Datadog, and New Relic. Confluent Cloud provides a Metrics API to return the performance data for throughput, latency, and other metrics that inform operators how the cluster is performing.
This blog post uses the Metrics API, Docker, and Prometheus, Grafana, Splunk, Datadog, and New Relic to put together a full monitoring solution for your Confluent Cloud deployment.
![]()
Docker Compose is used to coordinate the running of all the local services in
our monitoring stack connected to Confluent Cloud. Each section below walks you through the steps required to set up each service.
- Create a new Confluent Cloud API-key
- Setting up Prometheus and Grafana for Confluent Cloud
- Setting up Datadog with Confluent Cloud
- Setting up Splunk with Confluent Cloud
- Setting up New Relic with Confluent Cloud
First, you need to create credentials for our services to connect to the Metrics API. If you haven’t already, install the Confluent CLI. Please make sure that you have an active cloud cluster running before trying to create any Confluent CLI monitoring credentials. Note that the deprecated ccloud has now been migrated to the Confluent CLI confluent. To spin up a new Confluent Cloud cluster check out the quick start guide on Confluent Developer.
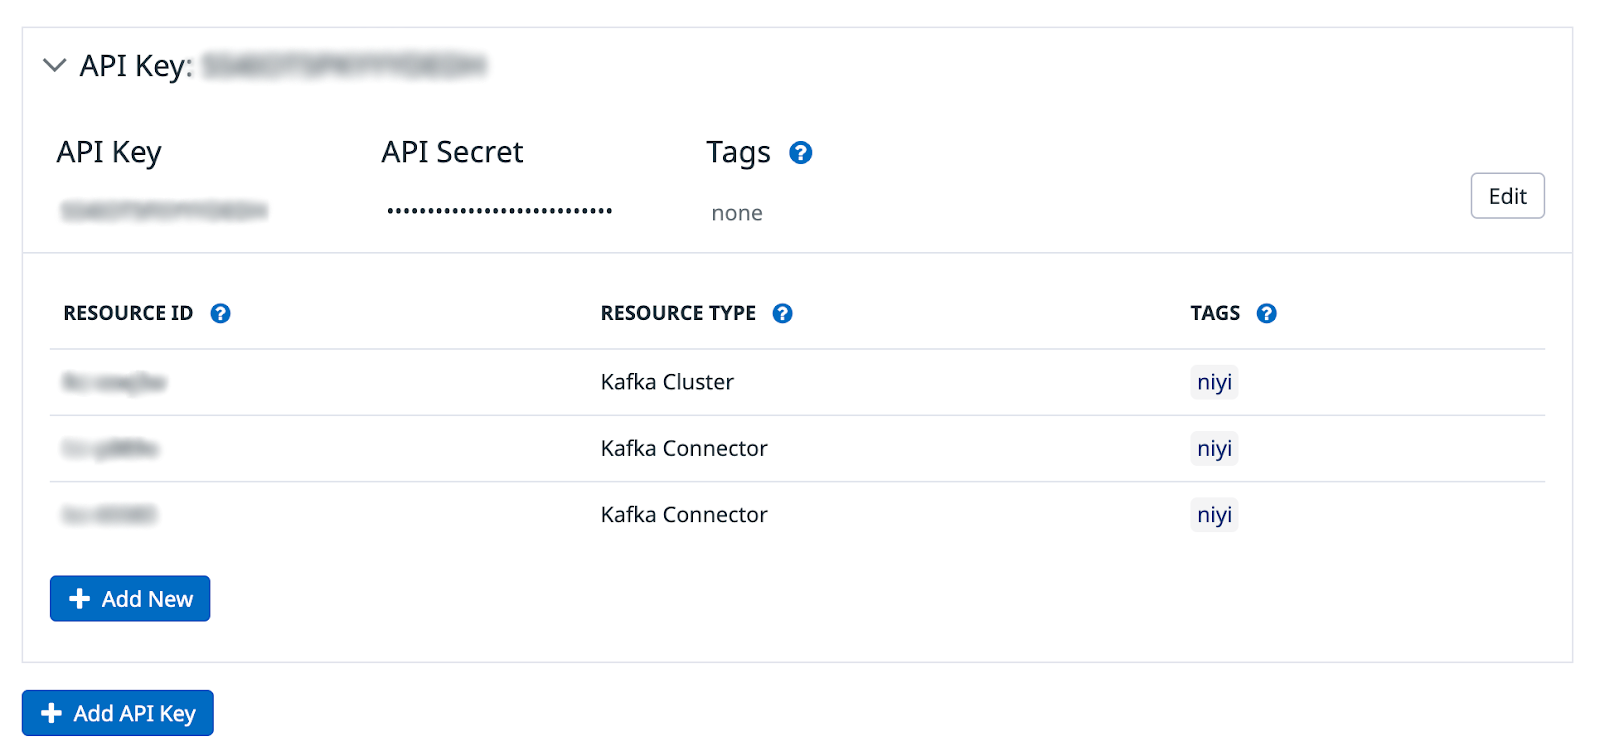
Create a new Confluent Cloud API-key
An API-key with cloud-level privileges has to be used to retrieve the Confluent Cloud metrics from the Metrics API. The cloud-level resource gives the API-key access to all of the resources in a Confluent Cloud cluster.
Once you have the API-key and secret, assign it to a service account and give it the role MetricsViewer. Please refer to the Metrics API documentation to see how to create a service account and assign the MetricsViewer role.
Setting up Prometheus and Grafana for Confluent Cloud
So what are Prometheus and Grafana? Prometheus is a time series database that scrapes metrics from data sources. Grafana is an observability platform that takes telemetry data from different sources and visualizes it in dashboards using graphs and charts.
Prometheus and Grafana work well together because Prometheus can gather data from a service’s open port and make the data available to Grafana to query to display as a visualization.
Create the following docker-compose.yml, adding a service for Prometheus and Grafana. The Prometheus container exposes its port on 9090. The Grafana service exposes its endpoint on port 3000, allowing a user to see the final visualization of the metrics in its UI.
prometheus:
  image: prom/prometheus
  hostname: prometheus
  container_name: prometheus
  ports:
    - 9090:9090
  restart: always
  volumes:
    - ./prometheus/:/etc/prometheus/
 grafana:
  image: grafana/grafana:7.4.1
  hostname: grafana
  container_name: grafana
  environment:
    GF_INSTALL_PLUGINS: grafana-piechart-panel
  ports:
    - 3000:3000
  volumes:
    - ./grafana/:/etc/grafana/
  depends_on:
    - prometheus
Next, create the following prometheus.yml file. In this file, specify the endpoint in the static_config.targets property where Prometheus scrapes the data from the Metrics API. You also can configure the frequency at which data is scraped by using the scrape_interval property.
global:
  scrape_interval:     1m # By default, scrape targets every 15 seconds.
  evaluation_interval: 1m # By default, scrape targets every 15 seconds.
Scrape_configs:
- job_name: Confluent Cloud
    scrape_interval: 1m
    scrape_timeout: 1m
    honor_timestamps: true
    static_configs:
      - targets:
        - api.telemetry.confluent.cloud
    scheme: https
    basic_auth:
      username:
      password:
    metrics_path: /v2/metrics/cloud/export
    params:
      "resource.kafka.id":
        - lkc-1234
        - lkc-2345
	"resource.connector.id":
        - lcc-1234
        - lcc-2345
- Targets: Endpoint for the Metrics API.
- Basic_auth: Specify the API key and secret.
- Params: List the resource labels for the Confluent Connect, Apache Kafka®, ksqlDB, and Schema Registry clusters.
To find the resource IDs for these components, please run the following commands on the Confluent CLI:- Kafka: confluent kafka cluster describe
- Connect: confluent connect list
- Schema Registry: confluent schema-registry cluster describe
- ksqlDB: confluent ksql app list
- Metrics_path: This is the export path of the endpoint that hosts the metrics.
Please note that in this example, the `prometheus.yml` file is located in a directory named `prometheus`. This directory is mounted as a volume in the Prometheus service of the `docker-compose.yml` file. The local directory (`./prometheus/) is mounted to the `/etc/prometheus` path in the prometheus docker container. There the service will pick up the Prometheus configuration.
Create a file named dashboard.yml. In order to set up Grafana successfully, you have to configure the predefined Confluent Cloud dashboard to use the Prometheus data source.
apiVersion: 1
providers:
- name: 'Prometheus'
  orgId: 1
  folder: ''
  type: file
  disableDeletion: false
  editable: true
  options:
  path: /etc/grafana/provisioning/dashboards
Last but certainly not least, you want to retrieve the Confluent Cloud JSON dashboard from Confluent's JMX-Monitoring-Stacks Github repo. You can import it directly in the Grafana UI when creating a new dashboard or mount it in the Grafana docker volume.
Please note that in this example, the `dashboard.yml` file and `ccloud.json` files are located in a directory named `grafana`. This directory is mounted as a volume in the Grafana service of the `docker-compose.yml` file. The local directory (`./grafana/) is mounted to the `/etc/grafana` path in the Grafana docker container. There the service will pick up the dashboard configs.
Once all of these files are set up correctly, you can run the following:
docker-compose up -d
You can see the Grafana dashboard with the data from the Metrics API by opening a browser to http://localhost:3000/ and the Prometheus site at http://localhost:9090/.
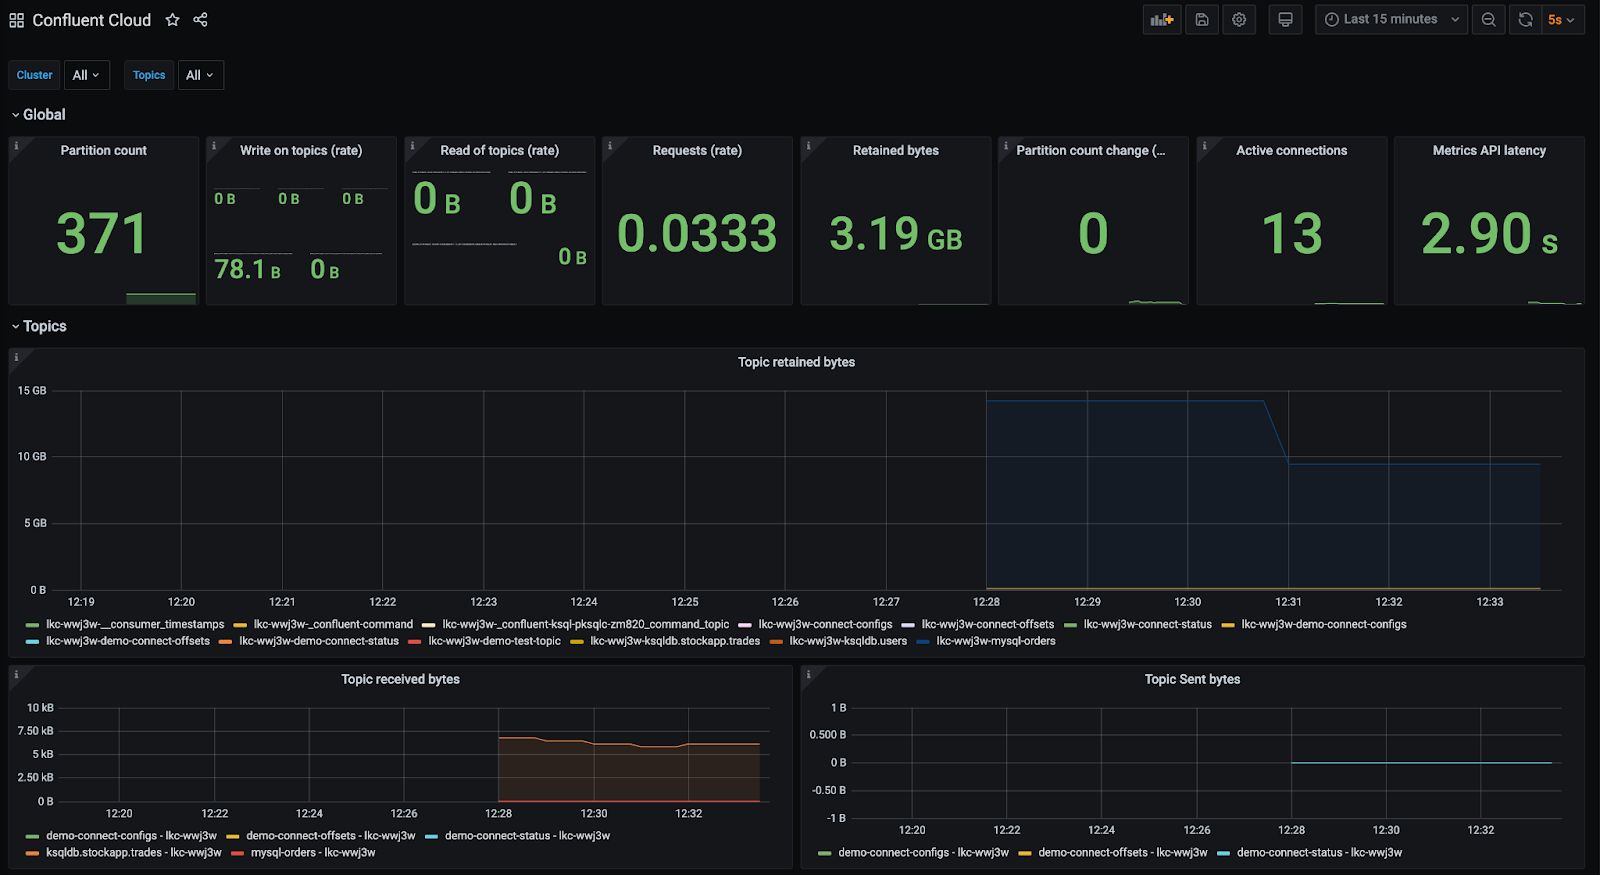
You can get a pre-configured Grafana dashboard for the Metrics API output by visiting the kafka-docker-playground GitHub repository.
Setting up Datadog with Confluent Cloud
Setting up Datadog with Confluent Cloud is now easier than ever. There’s no need to spin up a Docker container any longer. Simply go to your Datadog homepage, click on Integrations in the left panel and then search for “Confluent Cloud.”
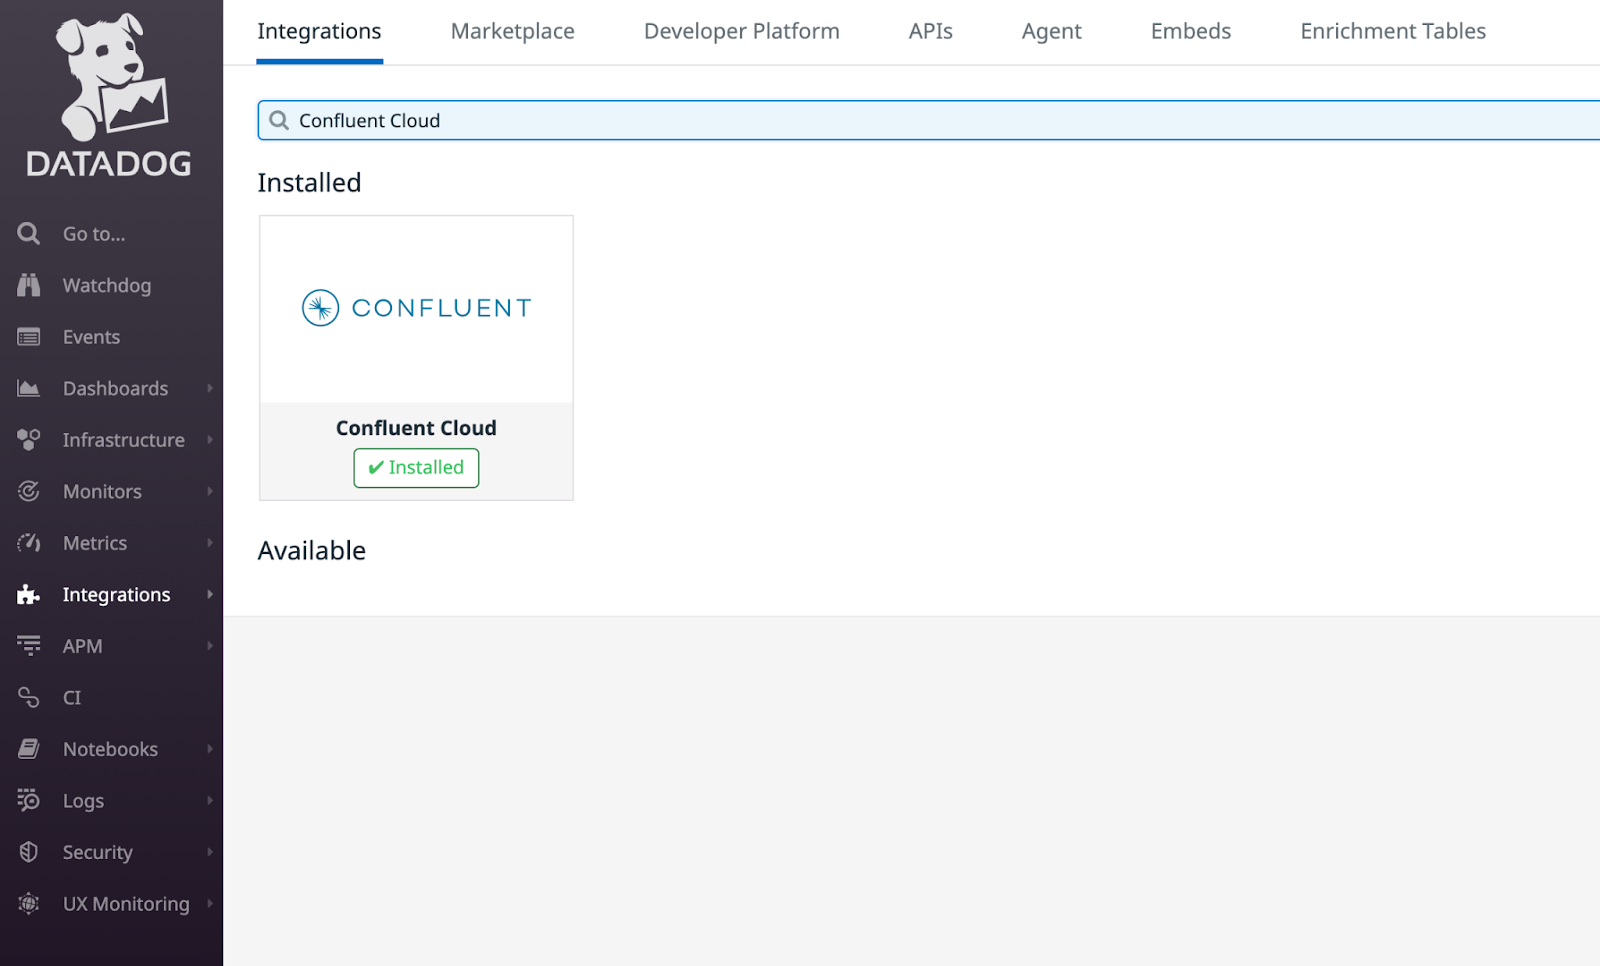
Install the integration. Once it is installed, click on “Add API-Key” and add your MetricsViewer role-based Confluent Cloud API-key and secret. Afterwards, add your Kafka cluster resource ID or any other component resource IDs that are hosted in Confluent Cloud.
Once you add your cluster to Datadog, wait a few minutes for the metrics to flow in and then create a dashboard.
Below is a screenshot of a sample Confluent Cloud dashboard in Datadog:
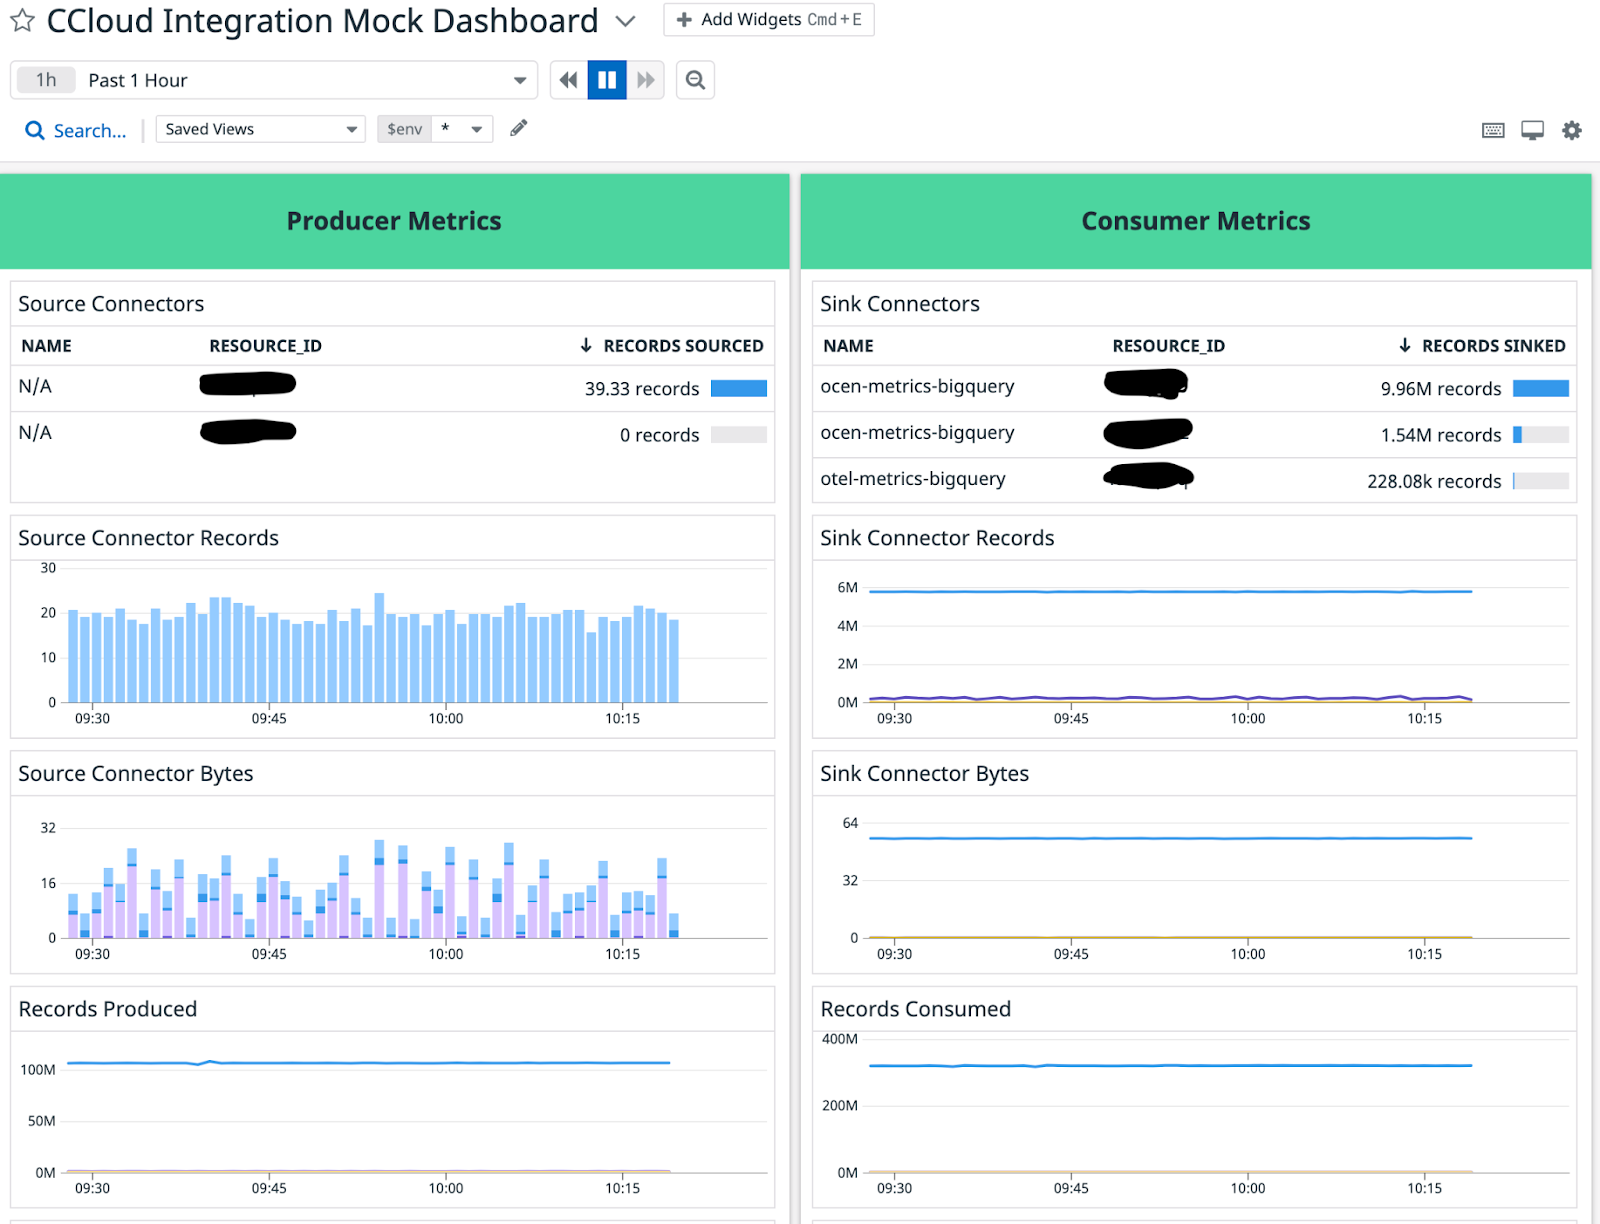
The dashboard above categorizes the fully managed connectors into producer and consumer metrics. There are eight panels in total. The top four panels show the number of records being written by the source connectors and the number of records being exported to the data source. The other panels show the throughput of the fully managed Confluent Cloud connectors.
Setting up Splunk with Confluent Cloud
This assumes that you have a Splunk Enterprise account that you want to forward your Confluent Cloud metrics too.
Start by adding the Splunk service to the docker-compose.yml. The SPLUNK_HEC_TOKEN and SPLUNK_PASSWORD values belong to your Splunk account. These are secret values and you should protect the “docker-compose.yml” file appropriately. Then you can specify the port number where you want to access Splunk.
# Splunk Enterprise server:
splunk:
 image: splunk/splunk:latest
 container_name: splunk
 environment:
   - SPLUNK_START_ARGS=--accept-license
   - SPLUNK_HEC_TOKEN=00000000-0000-0000-0000-0000000000000
   - SPLUNK_PASSWORD=changeme
 ports:
   - 18000:8088
 healthcheck:
   test: [ 'CMD', 'curl', '-f', 'http://localhost:8888' ]
   interval: 5s
   timeout: 5s
   retries: 20
 volumes:
   - ./splunk.yml:/tmp/defaults/default.yml
   - /opt/splunk/var
   - /opt/splunk/etc
Next, add another service called “Otelcollector,” short for OpenTelemetry Collector, to the docker-compose.yml. OpenTelemetry offers a vendor-agnostic way to receive, process, and export telemetry data. Splunk offers an OpenTelemetry integration that allows Splunk to get metrics from a data source using OpenTelemetry as the middleman. In the configuration below, the Telemetry Collector depends on the Splunk service.
# OpenTelemetry Collector
otelcollector:
 image: quay.io/signalfx/splunk-otel-collector:0.29.0
 container_name: otelcollector
 command: [ "--config=/etc/otel-collector-config.yml", "--log-level=DEBUG" ]
 volumes:
   - ./otel-collector-config.yml:/etc/otel-collector-config.yml
 depends_on:
   - splunk
Next, please go to the my-confluent-playground open source repository to get the otel-collector-config.yml config.
Add the contents from the otel config file and place it in a new file named open-telemetry.yml to specify the OpenTelemetry Collector configuration details. Then populate the Confluent MetricsViewer Cloud API Key/Secret in the username and password properties under the basic_auth field. Add your Confluent Cloud kafka cluster id as well as any other other cloud components you may be using.
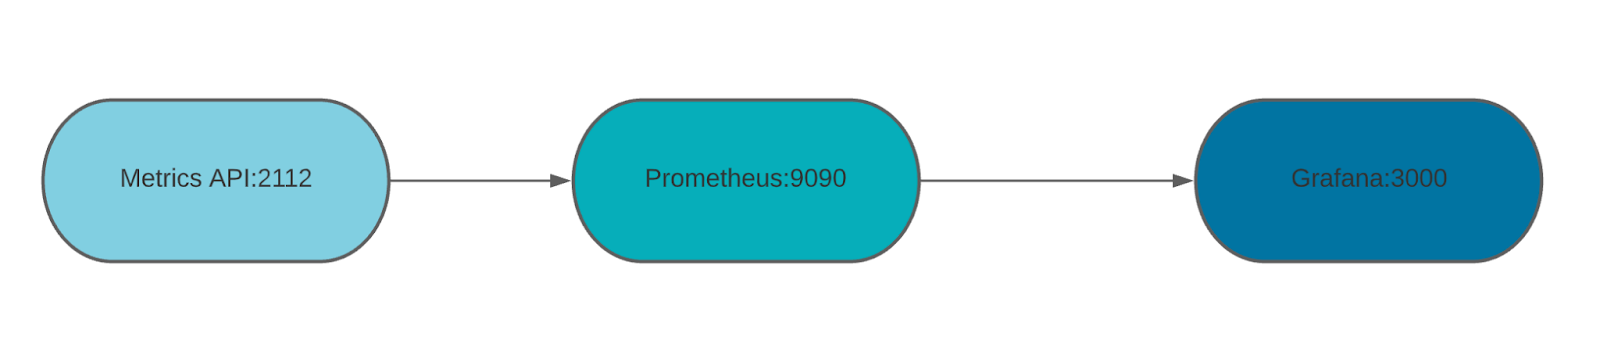
Please reference the OpenTelemetry Collector documentation to learn how to scrape from Prometheus’s metrics endpoints, which gets the metrics from the Metrics API. The flow in which the metrics travel is listed below:

This workflow is based on the Prometheus Federation feature.
The Splunk account’s HTTP event collector (HEC) token must be provided. Below is an example of the open-telemetry.yml file. The OpenTelemetry config file references the Confluent Cloud job that Prometheus scrapes.
   prometheus:
    config:
      scrape_configs:
        - job_name: 'otel-collector'
          scrape_interval: 2m
          scrape_timeout: 1m
          honor_timestamps: true
          static_configs:
            - targets: ['api.telemetry.confluent.cloud']
          scheme: https
          basic_auth:
            username: << CLOUD API KEY >>
            password: << CLOUD API SECRET >>
          metrics_path: /v2/metrics/cloud/export
          params:
            "resource.kafka.id":
              - "lkc-abcd" #logical cluster ID
            "resource.connector.id":
              - "lcc-xyz" #logical connector ID exporters:
 splunk_hec/metrics:
   # Splunk HTTP Event Collector token.
   token: "00000000-0000-0000-0000-0000000000000"
   # URL to a Splunk instance to send data to.
   endpoint: "https://splunk:8088/services/collector"
   # Optional Splunk source: https://docs.splunk.com/Splexicon:Source
   source: "app:metrics"
   # Optional Splunk source type: https://docs.splunk.com/Splexicon:Sourcetype
   sourcetype: "prometheus"
   # Splunk index, optional name of the Splunk index targeted.
   index: "metrics"
   # Maximum HTTP connections to use simultaneously when sending data. Defaults to 100.
   max_connections: 20
   # Whether to disable gzip compression over HTTP. Defaults to false.
   disable_compression: false
   # HTTP timeout when sending data. Defaults to 10s.
   timeout: 10s
   # Whether to skip checking the certificate of the HEC endpoint when sending data over HTTPS. Defaults to false.
   # For this demo, we use a self-signed certificate on the Splunk docker instance, so this flag is set to true.
   insecure_skip_verify: true
processors:
 batch:
extensions:
 health_check:
   endpoint: 0.0.0.0:13133
 pprof:
   endpoint: :1888
 zpages:
   endpoint: :55679
service:
 extensions: [pprof, zpages, health_check]
 pipelines:
   metrics:
     receivers: [prometheus_simple]
     processors: [batch]
     exporters: [splunk_hec/metrics]
Last, set up the Splunk configuration file by creating a splunk.yml in the same directory as the other two files. Below is an example of the Splunk config file. The OpenTelemetry Collector will forward the Confluent Cloud metrics to the Splunk endpoint: $SPLUNK_DB.
splunk:
 conf:
   indexes:
     directory: /opt/splunk/etc/apps/search/local
     content:
       metrics:
         coldPath: $SPLUNK_DB/metrics/colddb
         datatype: metric
         homePath: $SPLUNK_DB/metrics/db
         maxTotalDataSizeMB: 512000
         thawedPath: $SPLUNK_DB/metrics/thaweddb
Now, start up Splunk and OpenTelemetry.
docker-compose up -d
Once you verify that the applications are running successfully, visit Splunk at http://localhost:18000/en-US/app/search/analytics_workspace .
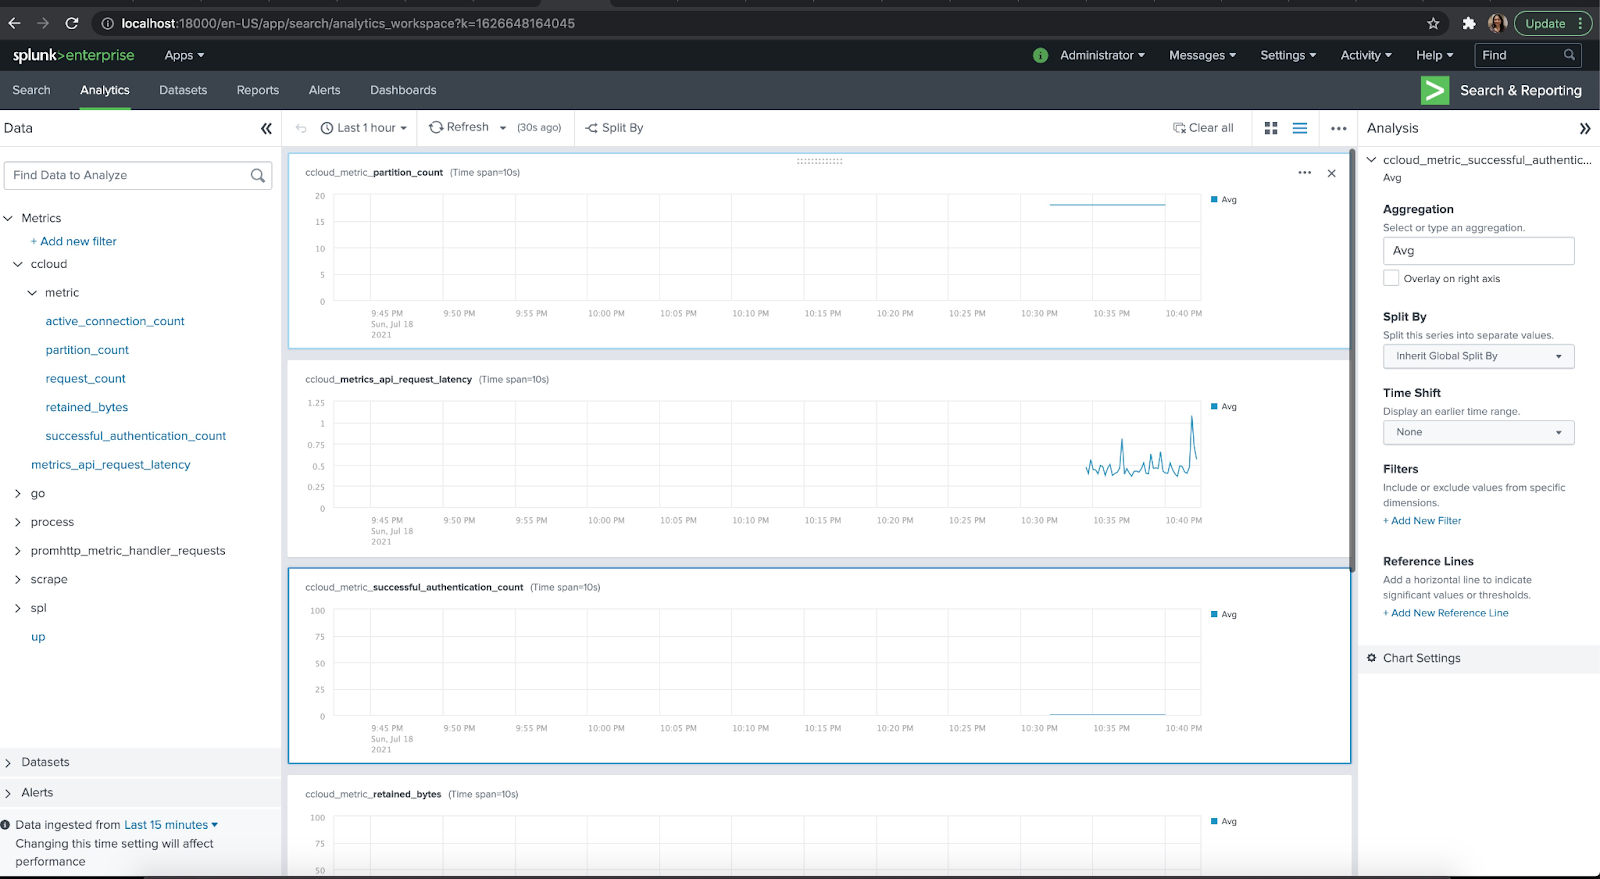
You can log in with the credentials username: admin password: changeme. This shows how to set it Confluent Cloud metrics within Splunk locally but these same steps can be applied to a higher environment.
Setting up New Relic with Confluent Cloud
Just like Splunk, New Relic allows you to collect Confluent Cloud Metrics using the Open Telemetry Collector.
Prerequisites
- If you haven't already done so, sign up for a free New Relic account.
- Get the for the New Relic account to which you want to report data.
- You must have a Confluent Cloud account with an API-KEY and API-SECRET. The Confluent service account associated with the credentials must have the MetricsViewer role.
Configure Open Telemetry Collector
First, visit the Open Telemetry Collector open source repository.
Then run the following commands in your terminal.
1. git clone https://github.com/newrelic/newrelic-opentelemetry-examples
2. cd other-examples/confluentcloud
3. make otelcontribcol
Update the collector.yaml in the direcory.
receivers:
  prometheus:
    config:
      scrape_configs:
        - job_name: 'otel-collector'
          scrape_interval: 2m
          scrape_timeout: 1m
          honor_timestamps: true
          static_configs:
            - targets: ['api.telemetry.confluent.cloud']
          scheme: https
          basic_auth:
            username: $CONFLUENT_API_KEY
            password: $CONFLUENT_API_SECRET
          metrics_path: /v2/metrics/cloud/export
          params:
            "resource.kafka.id":
              - $CLUSTER_ID #logical cluster ID
      #  OPTIONAL - You can include monitoring for Confluent connectors or schema registry's by including the ID here.
      #     "resource.connector.id":
      #        - $CONNECTOR_ID
      #     "resource.schema_registry.id":
      #        - $SCHEMA_REGISTRY_ID

exporters:
  otlphttp:
    endpoint: $NEW_RELIC_OTLP_ENDPOINT
    headers:
      api-key: $NEW_RELIC_LICENSE_KEY
processors:
  batch:

service:
  pipelines:
    metrics:
      receivers: [prometheus]
      processors: [batch]
      exporters: [otlphttp]
Please ensure that you have the correct values for the following properties:
- Cloud API Key
- CONFLUENT_API_KEY
- CONFLUENT_API_SECRET
- New Relic Ingest Key
- NEW_RELIC_LICENSE_KEY
- CLUSTER_ID
- Cluster ID from Confluent cloud
- Cluster key/secret should be specific to this cluster
Run the Open Telemetry Collector in Docker
Verify that the docker-compose.yaml is correctly referencing the environment variables you have created for New Relic and Confluent Cloud.
version: "3.6"

services:

  otel-collector:
    image: otel/opentelemetry-collector-contrib:0.92.0
    command: --config=/etc/otelcol/config.yaml
    volumes:
      - ./collector.yaml:/etc/otelcol/config.yaml
    environment:
      - NEW_RELIC_OTLP_ENDPOINT
      - NEW_RELIC_API_KEY
      - CONFLUENT_API_KEY
      - CONFLUENT_API_SECRET
      - CLUSTER_ID
      - CONNECTOR_ID
      - SCHEMA_REGISTRY_ID
Run the docker composee up command to start the collecting metrics from your Confluent Cloud cluster into New Relic.
docker-compose up -d
For more information on setting up Confluent Cloud with New Relic, visit the official New Relic Confluent Cloud documenation .
Conclusion
Confluent Cloud offers Apache Kafka as a fully managed service and allows organizations to monitor the clusters with some of their favorite Application Performance Monitoring solutions. As the demand and popularity of Confluent Cloud grows, so will the number of monitoring solutions that can be used to integrate with it.
이 블로그 게시물이 마음에 드셨나요? 지금 공유해 주세요.
Confluent 블로그 구독


Customer Intelligence Hub: A Single Pane of Glass for Customer Insight and Action
Customer Intelligence Hub unifies customer signals into a real-time, AI-powered view that helps GTM teams prioritize risk, identify opportunity, and act faster with contextual insights.